HSFM09 - Webcartografie
Les 2. JavaScript en web mapping
- Huiswerk bespreken
- Web mapping
- JavaScript
- Web mapping libraries
- Code, code & code!
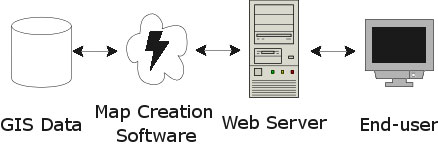
What is a web map?
Analogue paper maps
| Digital maps | VS | Web Maps |
|---|---|---|
| Data | Tiles, styles and servers | |
| On the computer | View in a browser | |
| Calculate, analyze | scroll, pan, zoom |
google.com/maps
openstreetmap.org
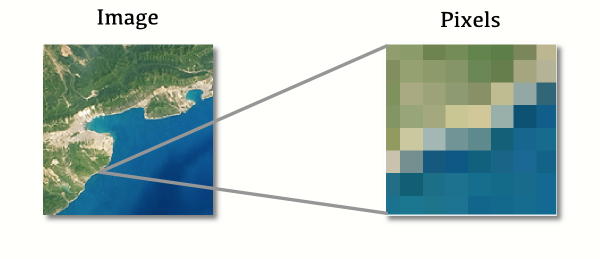
Tiled web map
a little History
Digital maps & GIS software
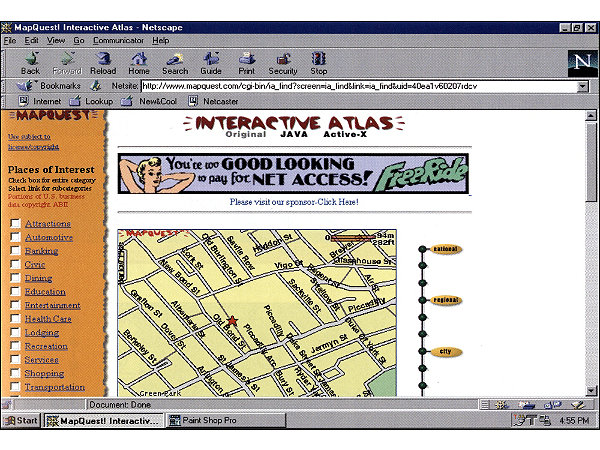
1996 Mapquest first with a web service!
But really slow to load..
2004 - Endoxon found a way for quick online mapping!
2005 Google Maps took over!
The solution?
Tiles!
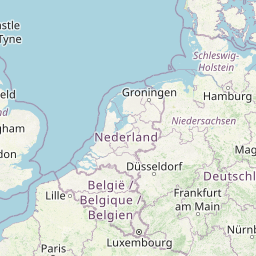
Tiles
All tiles size 256x256 pixels
Placed in a grid, sharing boundaries
Seamless map
All these little tiles load way faster than one big map!
We call this slippy maps
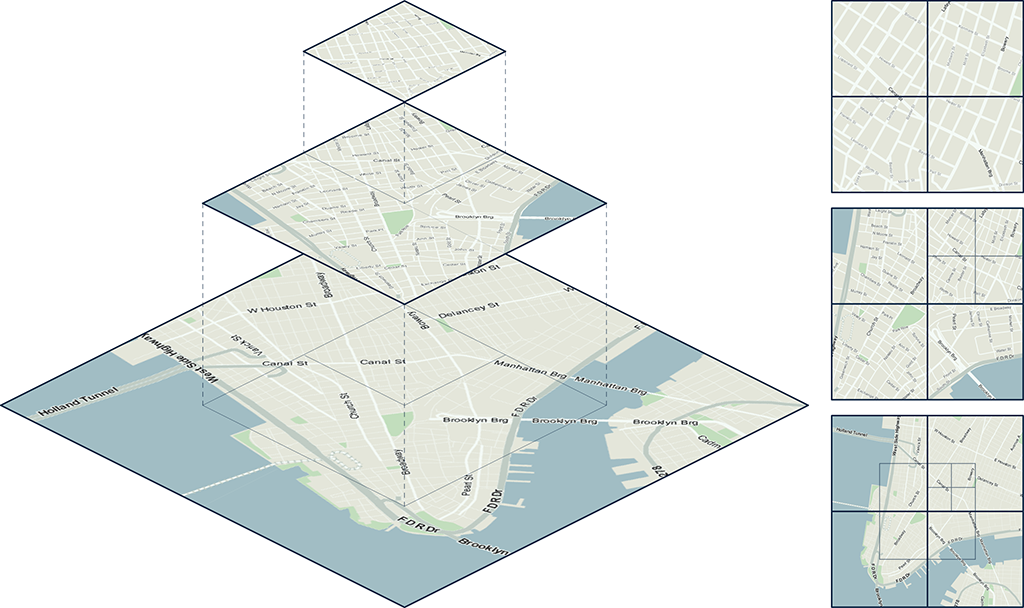
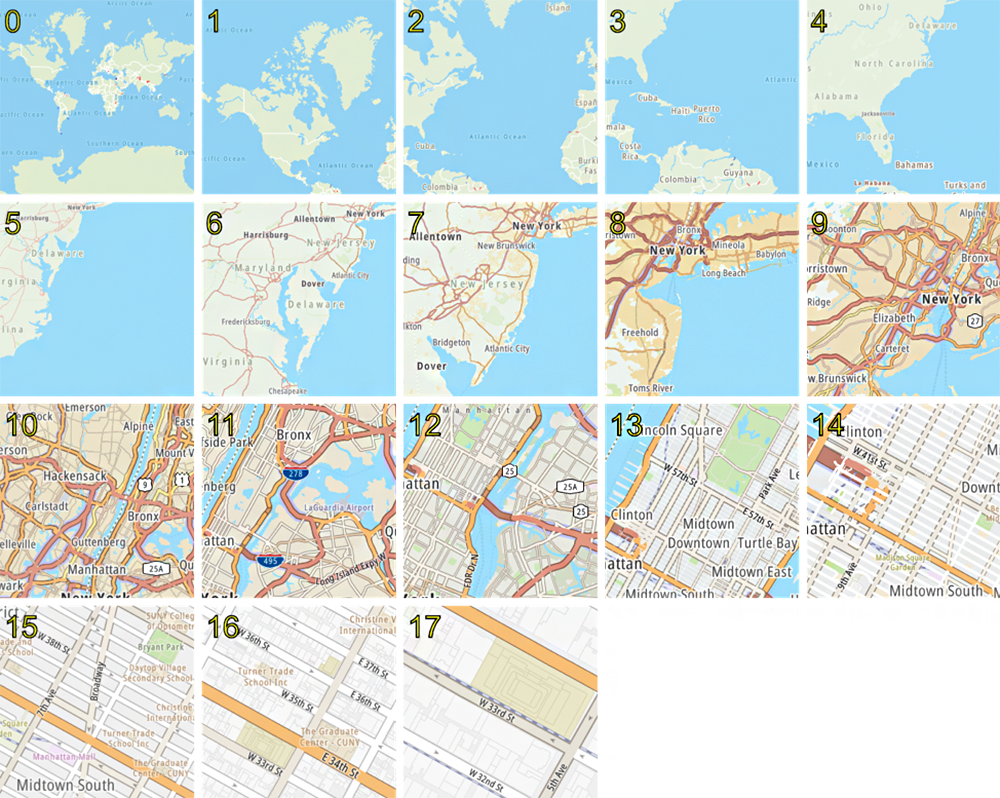
Zoom levels
Each zoom level has its own set of tiles!
Zoom level 0: 1 tile for the whole world.
Increases exponentially...
Zoom level 1: 4 tiles
Zoom level 2: 16 tiles
etc.
 Map with tile bounds
Styling & Serving tiles
Tiles are styled and rendered in advance
Tiles are just images on the web
http://tile.openstreetmap.org/5/16/10.png
/z/x/y

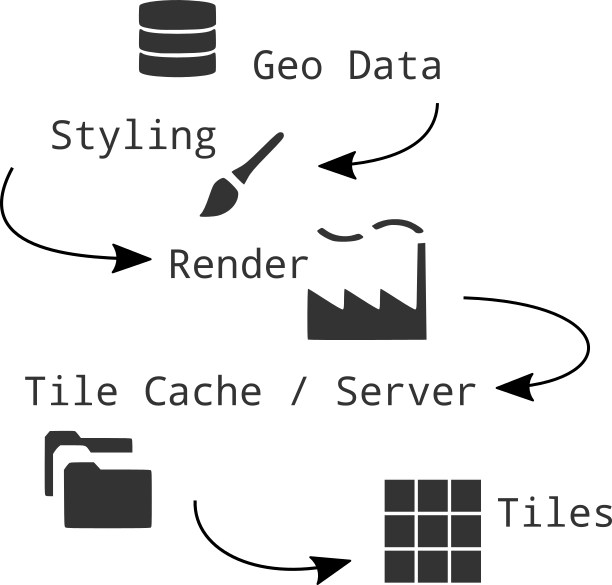
Styling tiles
styling per zoom level
Lot's and lot's of geo data!
Advantages Raster tiles
Fast
Showing a huge amount of geo data with small file size
It's proven by time technology, which works on all types of devices (desktop and mobile) and all browsers
Rendered on a server, raster map tiles do not create performance load on client site
Disadvantages Raster Tiles
No interaction with objects
No information available about objects
Multiple visualizations = multiple tile sets
elaborate & hard styling syntax
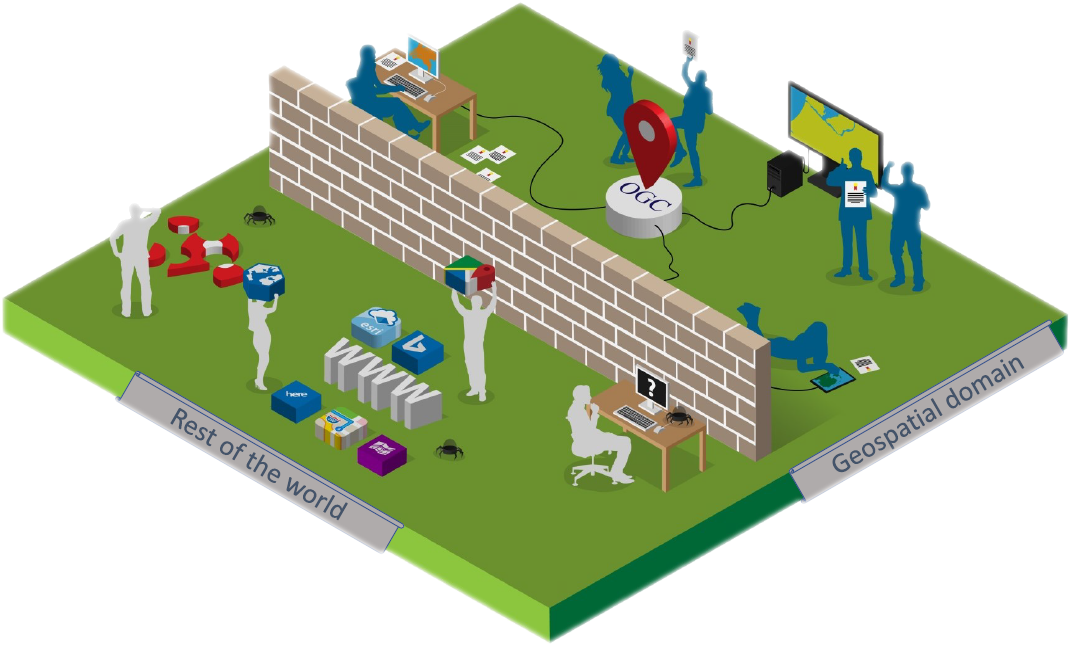
Open Geospatial Consortium - OGC standards
- WMS Web Map Service
- WMTS Web Map Tile Service
- WFS Web Feature Service
Defacto - Community standard
- Google/OSM (XYZ)
- TMS Tile Map Service
- QuadTrees (microsoft)
Making a web map
a map is a lot!
- Map Interface and Interaction
- Zoom, panning, clicking etc.
- Map events
- popups markers
- Tiles (raster/vector) as Base Layer
- Additional Data
- File (GeoJSON)
- WMS,WFS
- Tiles
JavaScript!
Puts it all together,
Tiles, content, interaction
JavaScript Library
Including a JavaScript library in your code is like copying and pasting someone else's code into yours. You have access to everything in that library.
In our case, it's a bunch of cool tools to make web maps and give them familiar functionality.
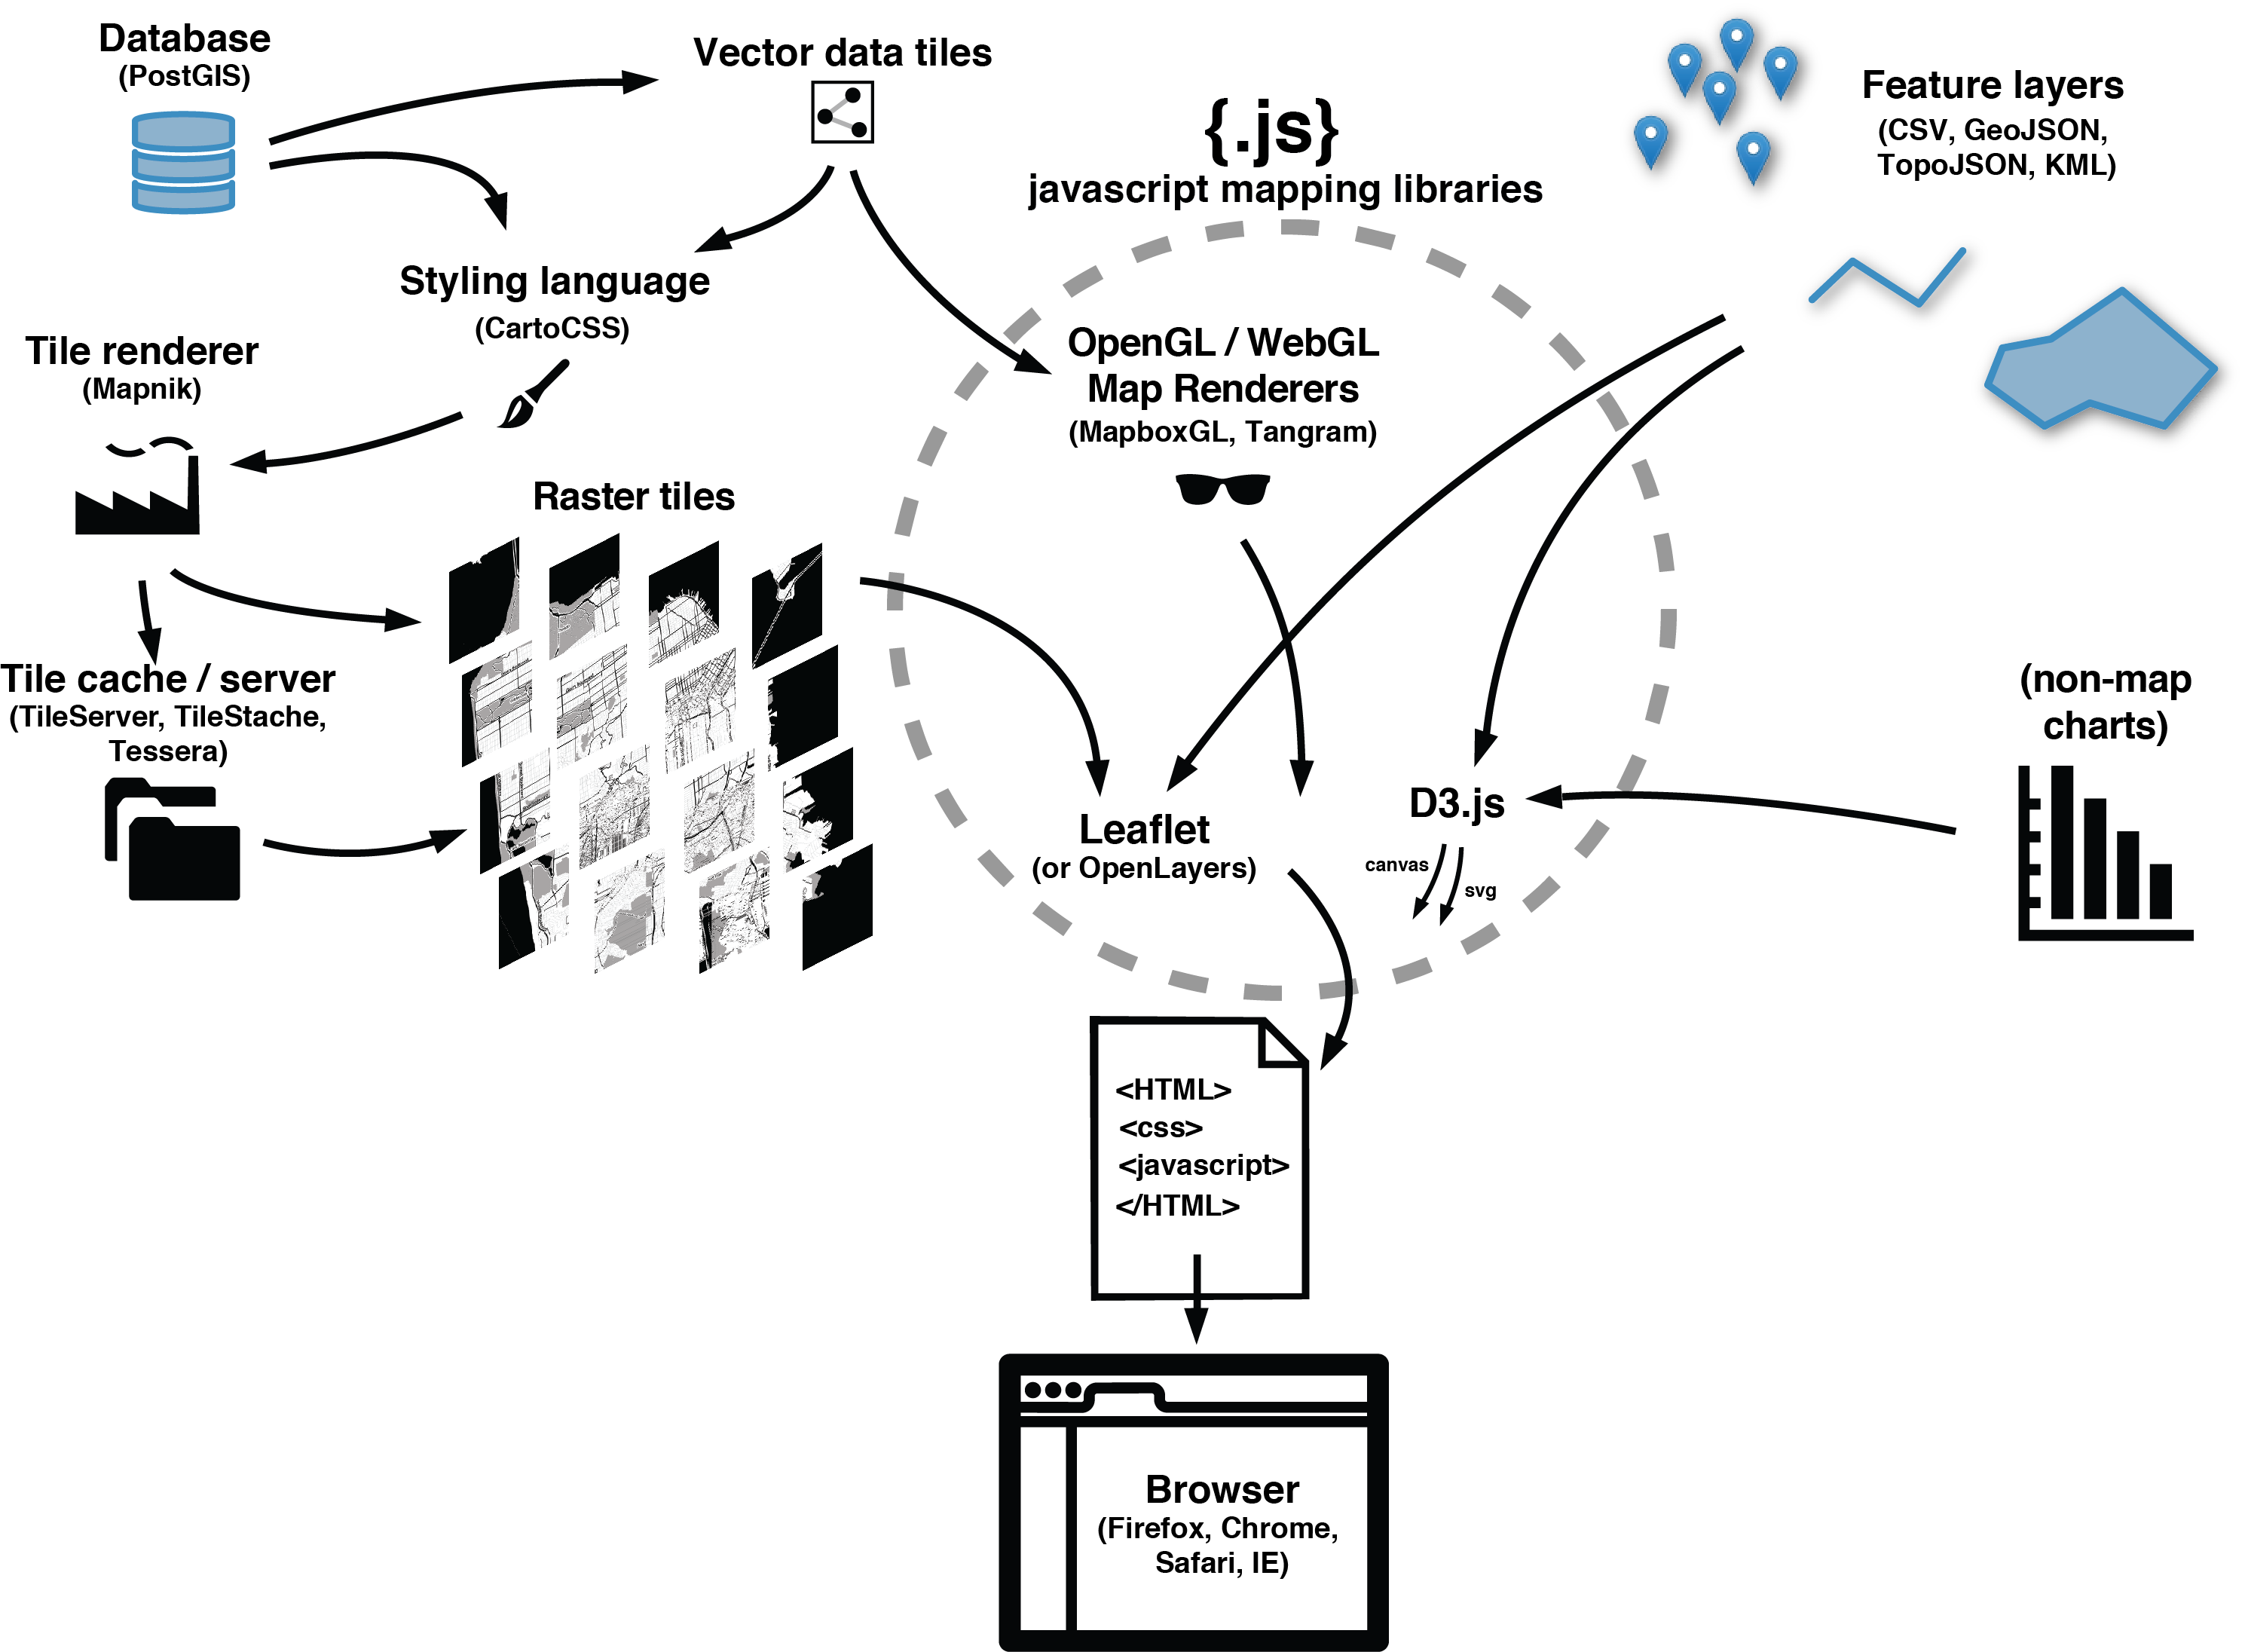
Web Map Building blocks
Web page, HTML, CSS & JS
JS mapping library
Base Layer - tiles
Additional Data:
Data, files, api, GeoJSON, WMS, WFS
Vector Layers
Interface and Interaction
Zoom, panning, clicking etc.
JavaScript
link
link 2
Structuur
Code van boven naar beneden!
							// Dit is een comment
							alert('Hello, world!'); // This comment follows the statement
Variables
Variabelen worden gebruikt om informatie op te slaan
named storage
						let message;
						message = 'Hello'; // store the string 'Hello' in the variable named message
						alert(message); // shows the variable content
camelCaseNames!!
constants
						const myBirthday = '18.04.1982';
						myBirthday = '01.01.2001'; // error, can't reassign the constant!
Data types
						typeof undefined // "undefined"

						typeof 0 // "number"

						typeof true // "boolean"

						typeof "foo" // "string"

						typeof Math // "object"

						typeof {} // "object"

						typeof alert // "function"
Events
						document.querySelector('html').addEventListener('click', function() {
							alert('Ouch! Stop poking me!');
						  });
Objects
							const person = {
								name: ['Bob', 'Smith'],
								age: 32,
								bio: function() {
								  console.log(`${this.name[0]} ${this.name[1]} is ${this.age} years old.`);
								},
								introduceSelf: function() {
								  console.log(`Hi! I'm ${this.name[0]}.`);
								}
							  };


							person.name
							person.name[0]
							person.age
							person.bio()
							person.introduceSelf()
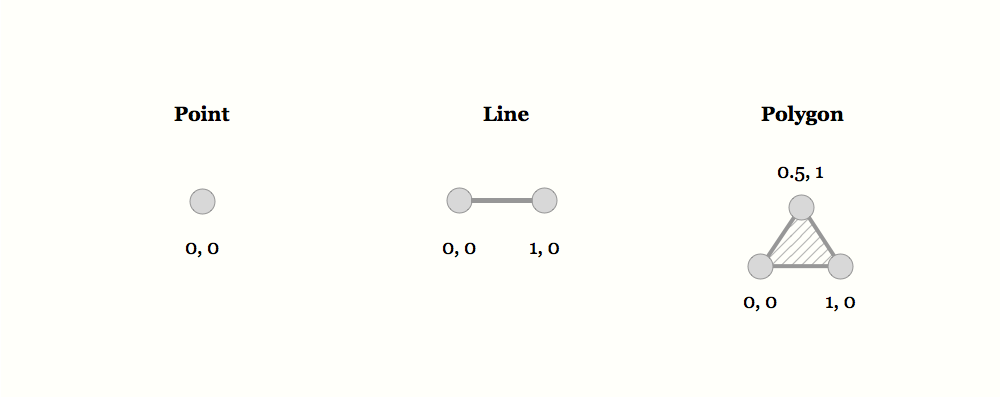
GeoJSON
https://geojson.org/ geojson.ioLoops
							const cats = ['Leopard', 'Serval', 'Jaguar', 'Tiger', 'Caracal', 'Lion'];

							for (const cat of cats) {
							console.log(cat);
							}

							for (let i = 0; i < cats.length; i++) {
								console.log(cats[i]);
							}
Wanneer gebruik je wat nou?
JavaScript Libraries for Mapping
Leaflet.js for simple light weight raster web maps
OpenLayers for more elaborate raster web map with more functionality
ArcGIS Javascript API if your client uses ESRI software
D3.js for data driven info graphics
MapboxGL.js for vector tiles
MapLibre for vector tiles open source alternative
Mapbox Studio for easy cloud solutions
CARTO and buisness intellegence & cloud solutions
HERE Maps and Google Maps API for navigation, Google services and commercial goals
Turf.js for geospatial computation in the browser
Main considerations
Open source vs closed source
Amount of Interactivity or GIS functionality
Amount of data to show
Raster vs Vector
projection
We gaan kijken naar
Leaflet JS
OpenLayers Js
MapLibre
ArcGIS JS API
Leaflet.js
Leaflet.js
An Open-Source JavaScript Library for Mobile-Friendly Interactive Maps
simplicity, performance and usability
Developed by: Vladimir Agafonkin.
Weighing about 38 KB of JS.
Has all the mapping features most developers ever need.
Can be extended with Plugins
Well documented
What Leaflet does not do:
Provide data for you.
Provide the basemap.
Its not GIS
Leaflet is a framework
Raster tile base map providers

Leaflet quickstart
							let map = L.map('mapid').setView([51.505, -0.09], 13);

							L.tileLayer('http://{s}.tile.osm.org/{z}/{x}/{y}.png', {
							  attribution: '© OpenStreetMap contributors'
							}).addTo(map);
Adding data layers
webmapper // ADD a WMS layer let cbs = L.tileLayer.wms('https://geodata.nationaalgeoregister.nl/wijkenbuurten2018/wms', { 'layers': 'cbs_buurten_2018', 'styles': 'wijkenbuurten2018:wijkenbuurten_thema_buurten_gemeentewijkbuurt_percentage_eenpersoonshuishoudens', 'srs': 'EPSG:28992', 'format': 'image/png', 'transparent': true, 'opacity': 0.5 }).addTo(map);Layers
Base Layer
Raster
Data Layer / Feature Layer
Vector
Projections
Use EPSG:28992 > Government in Netherlands obliged to use it!
OpenLayers.js
MapLibre.js
MapboxGL.js
December 2020: Mapbox GL JS v2 is not free anymore
more infoPrevious Mapbox GL JS v1 is still available under the free and open BSD3 license
MapLibre!
 https://maplibre.org/
MapLibre docs overview
					  var map = new maplibregl.Map({
						container: 'map',
						style: 'https://api.maptiler.com/maps/streets/style.json?key=get_your_own_OpIi9ZULNHzrESv6T2vL', // stylesheet location
						center: [-74.5, 40], // starting position [lng, lat]
						zoom: 9 // starting zoom
						});
style.json
																  {
																	"version": 8,
																	"name": "Mijn eigen Stijl",
																	"sprite": "url",
																	"glyphs": "url/{fontstack}/{range}.pbf",
																	"sources": {...},
																	"layers": [
																	{
																	  "id": "background",
																	  "type": "background",
																	  "paint": { "background-color":"#FFFFFF" }
																	},
																	{
																	  "id":"water",
																	  "source": "osm",
																	  "source-layer":"water",
																	  "paint":{
																		"fill-color":"#0000ff"
																	  }
																	},
																	{...}
																	]
																  }
Layers or layers ???
Source
Data layers in tile
Style layer in style
Leaflet every source is a layer


Use MapLibre for
Customized background maps
Interactive data
WebGL rendering
Use MapboxGL.js for
3D maps
Provided data
Commercial projects