"Let's put it on the map!"
How to design a cuddly, eye-blinking digestible
and accessible geo-data visualization?
Niene Boeijen
Some expectation management
I do not have the answer

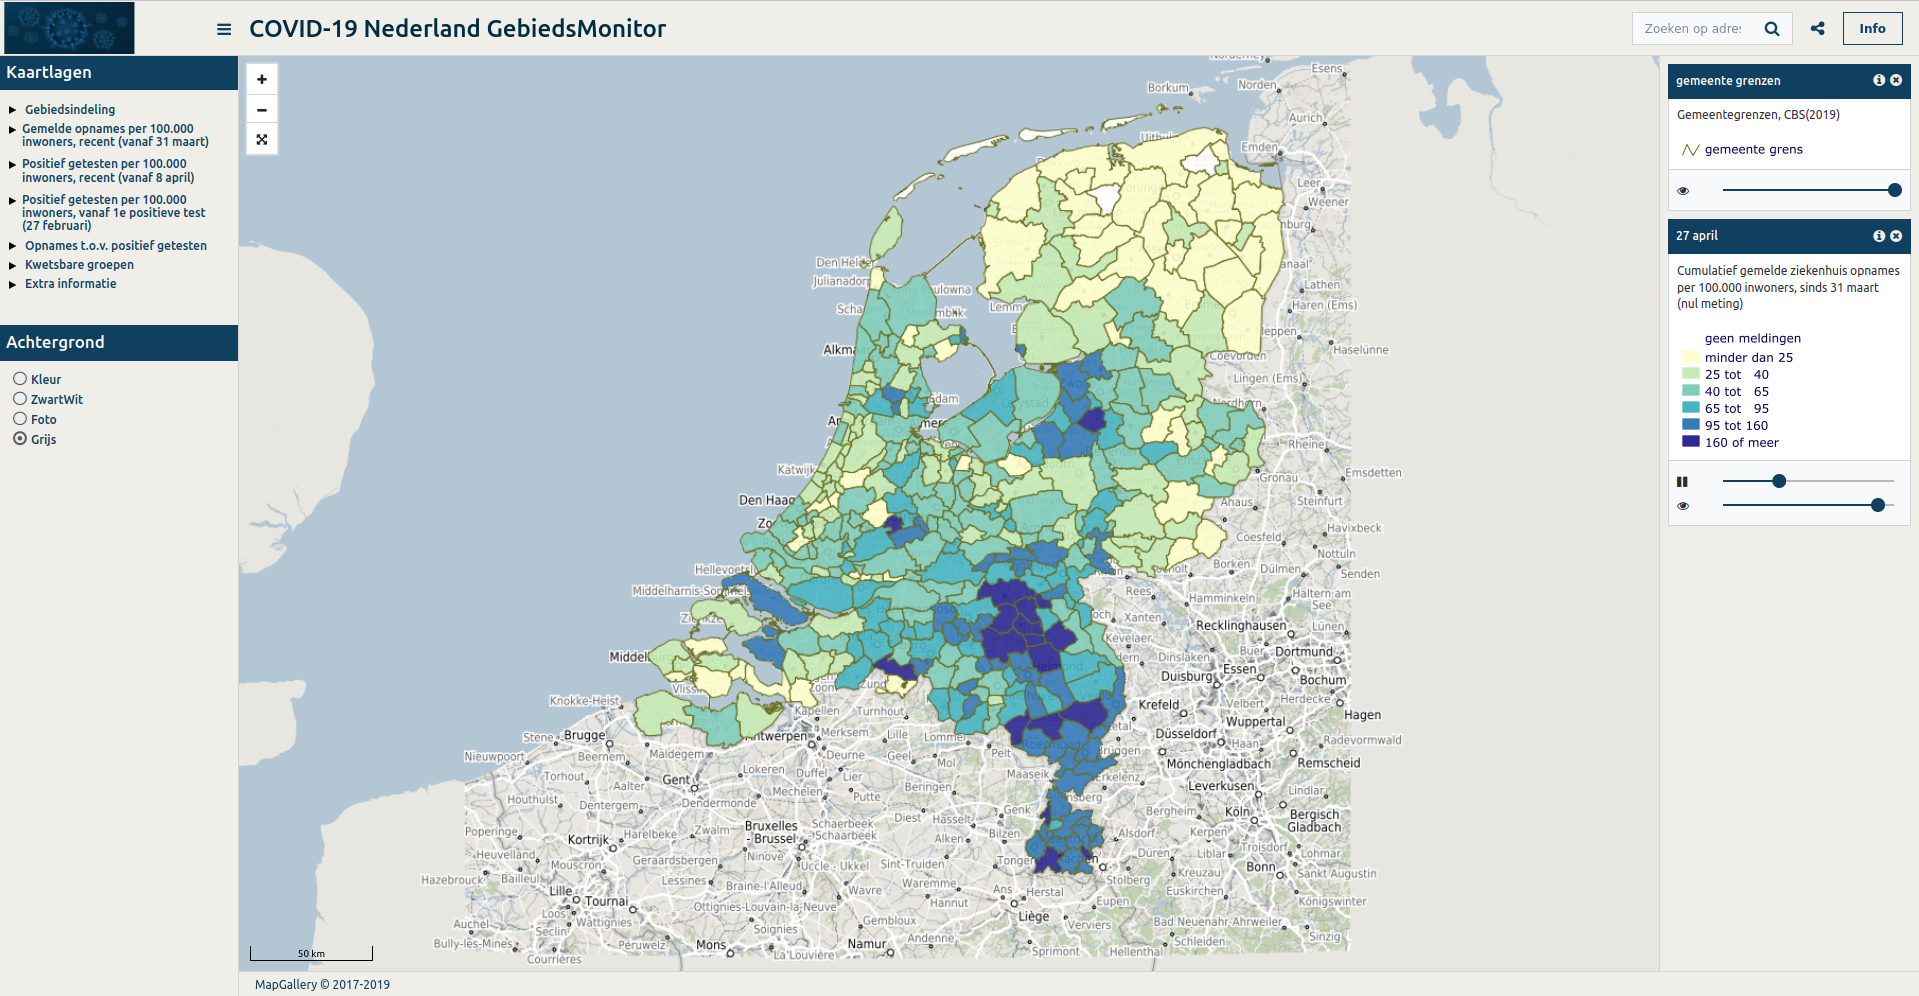
Maps have gone viral
Digital, interactive, map as main focus
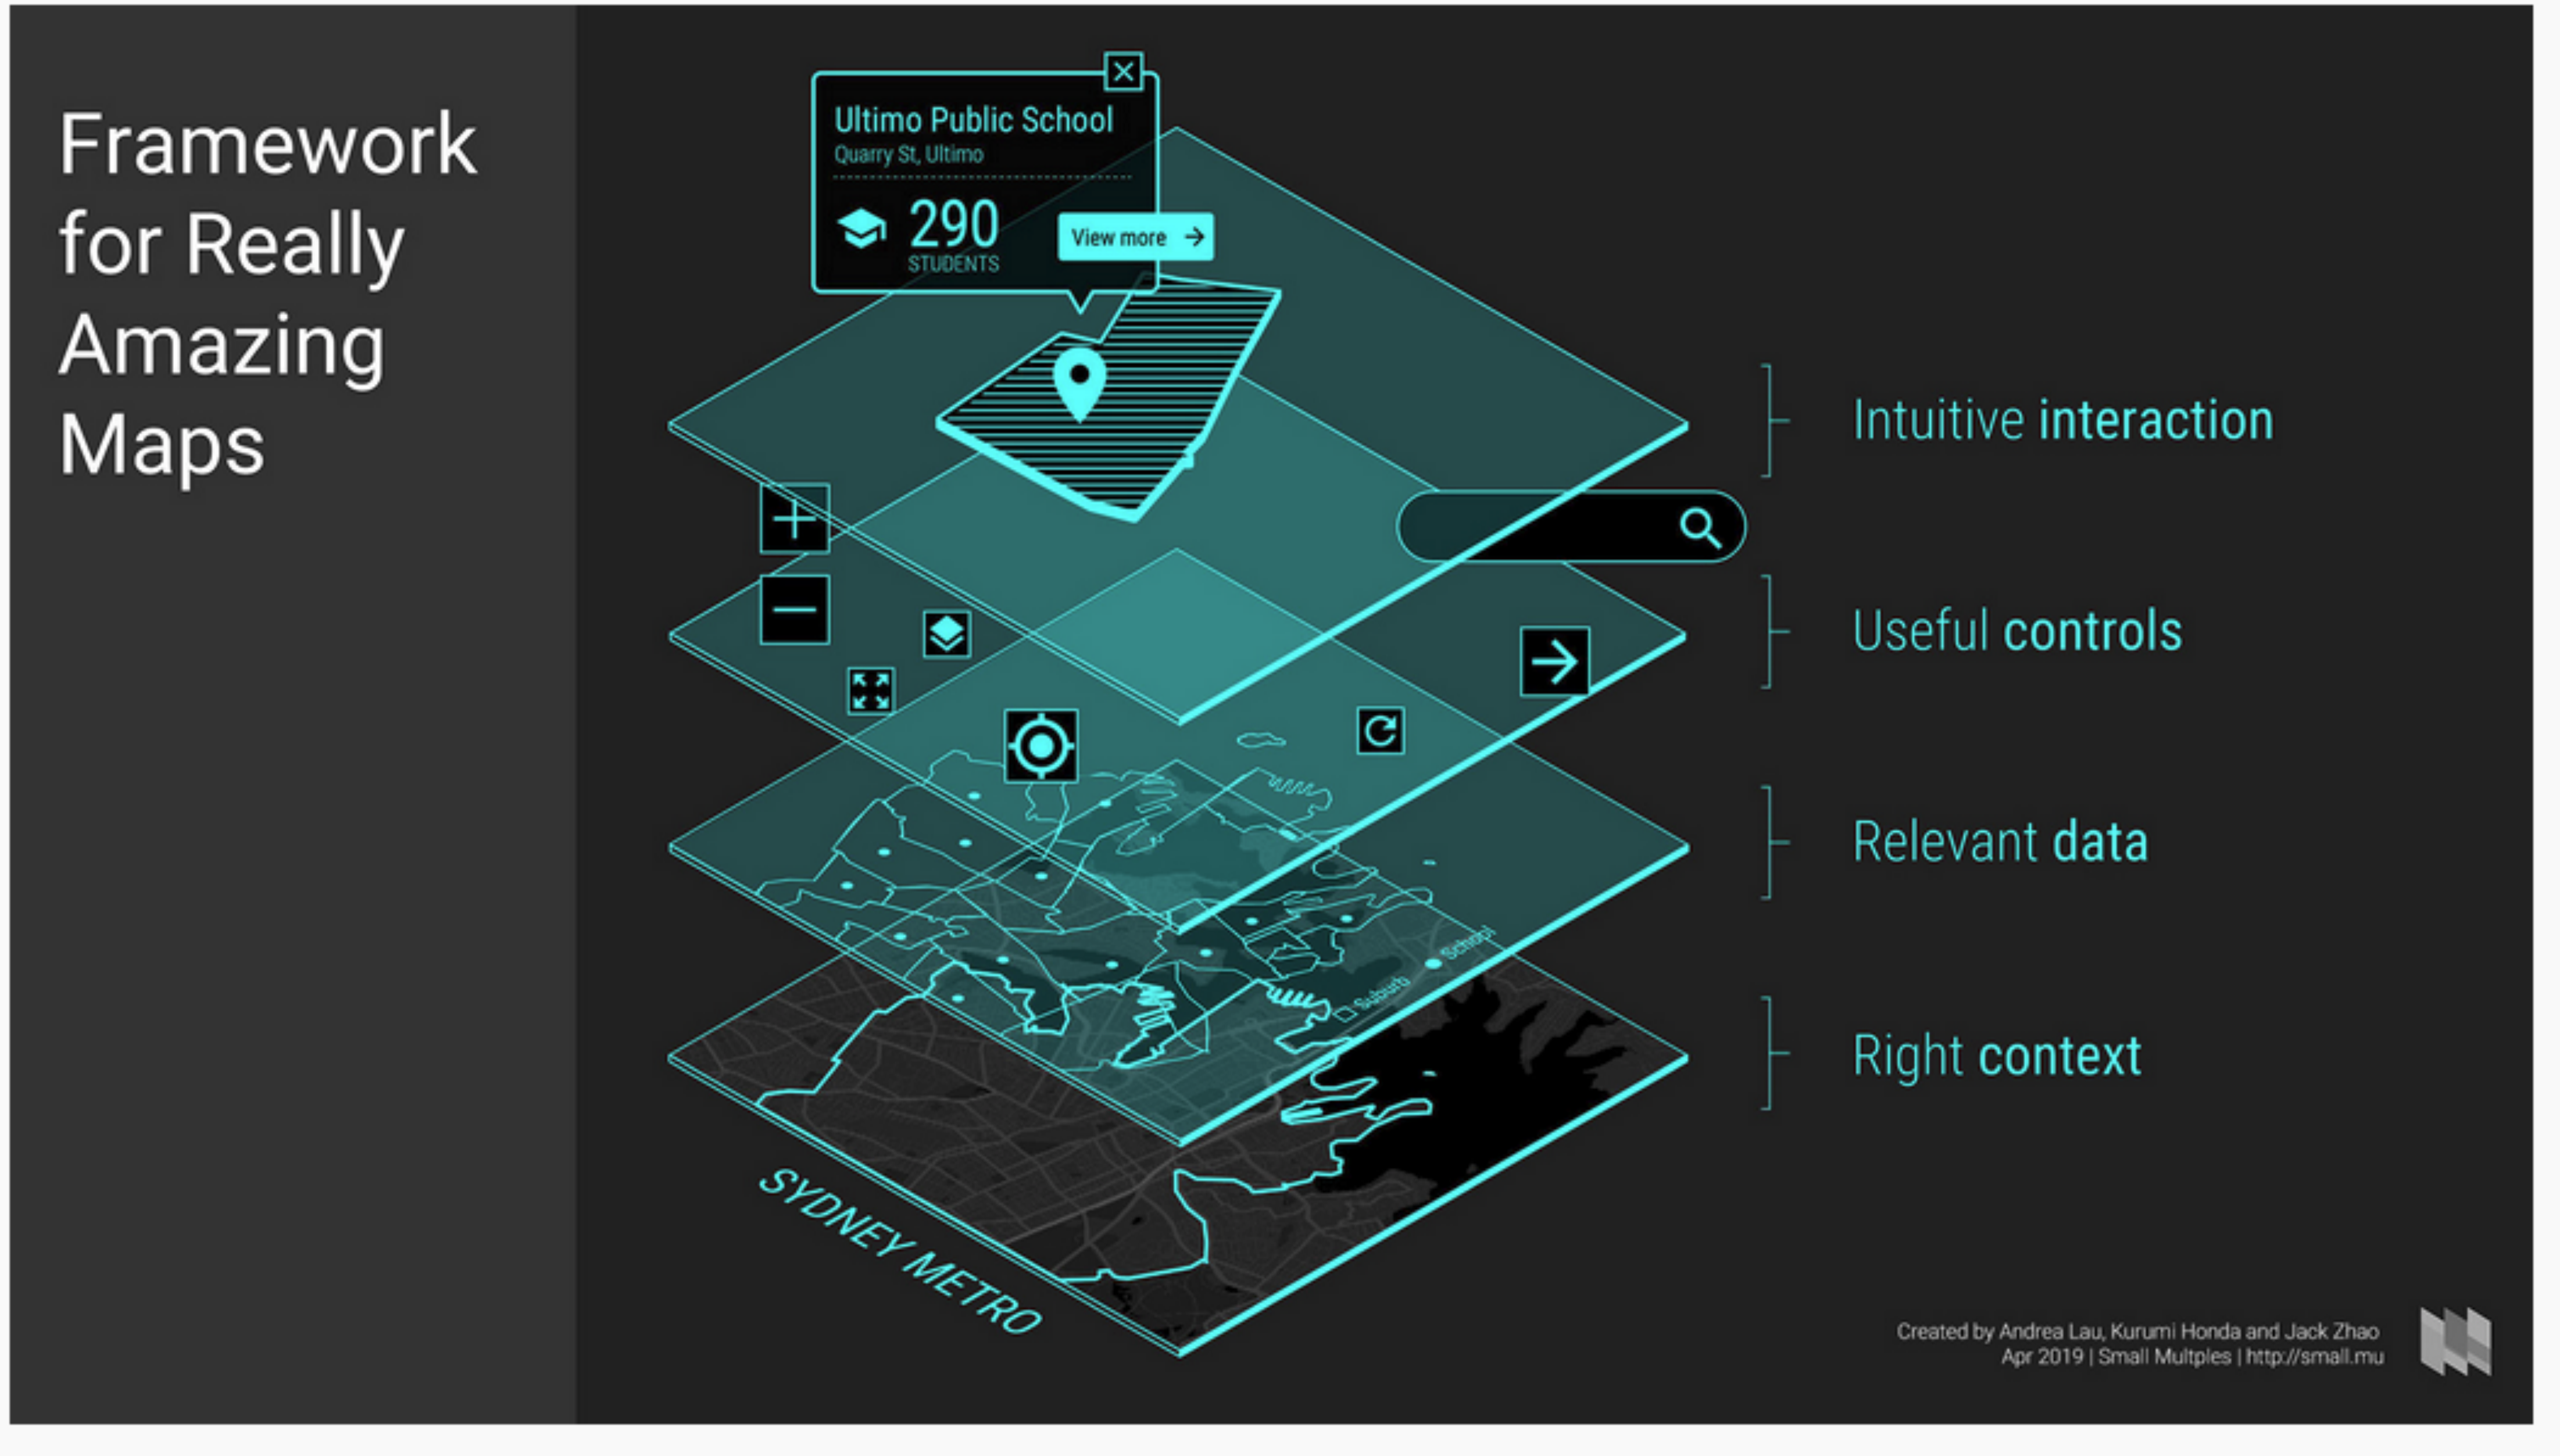
The key components
- Cartography
- Front-end Design
- Interaction Design
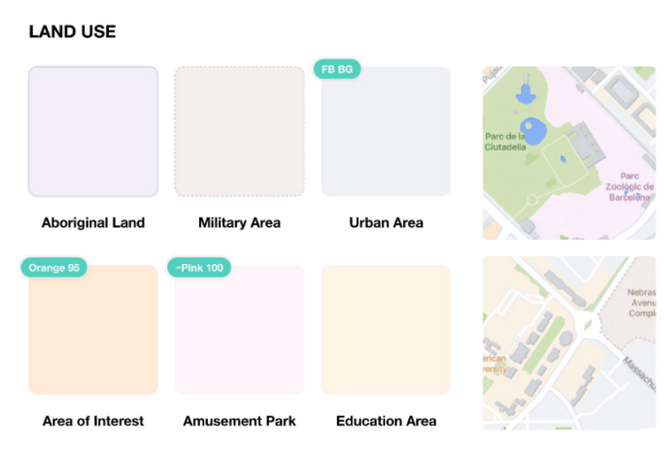
a new kind of Cartography
Soo much possible these days

Make a unique map.
Do not paste in Google maps..
Customize
Integrate the cooperate/brand identity colors and font
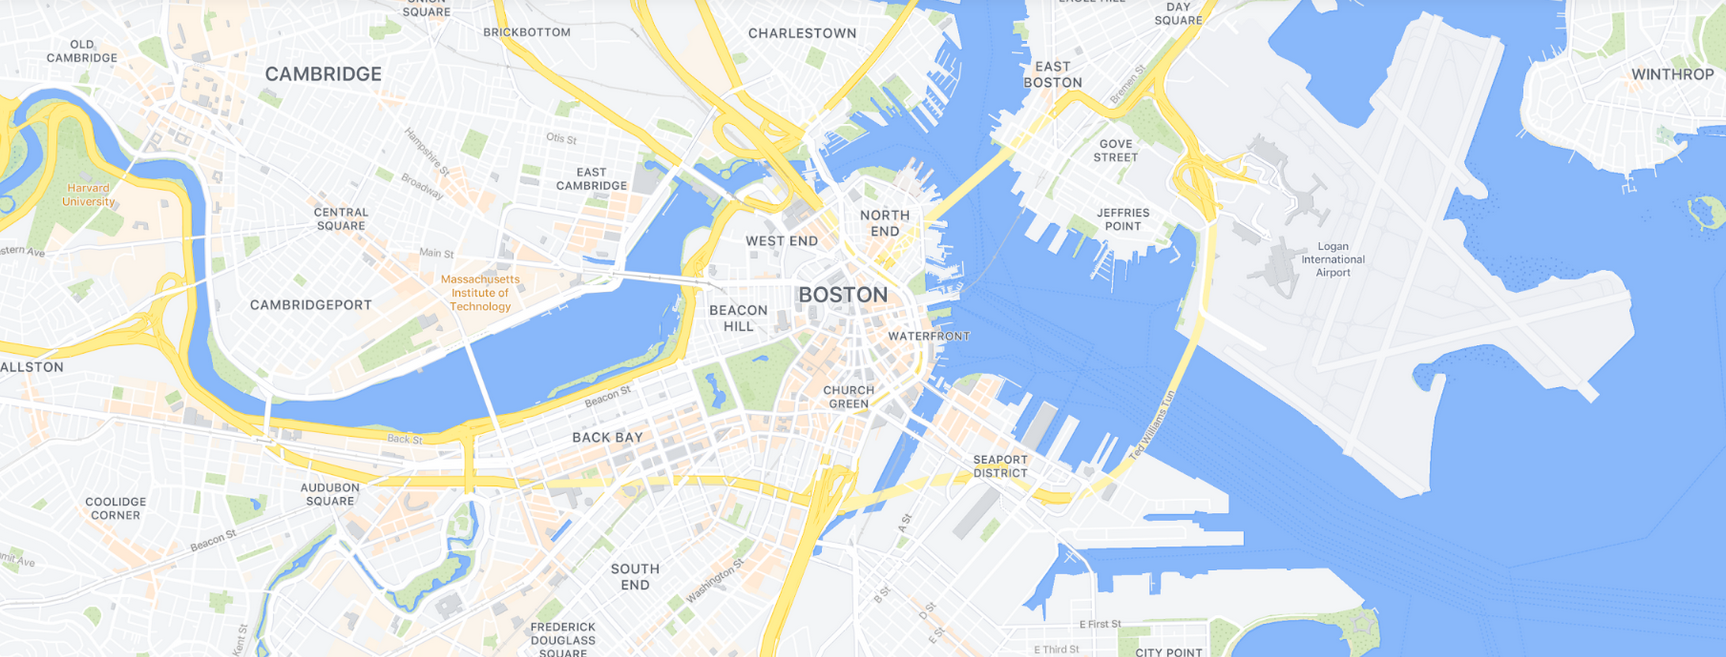
Clutter
Leave out clutter
Front-end Design
Pro tip: Hire a front-end designer
Interaction Design
Maps have become increasingly interactive
Robert E. Roth (2015)
Cartographic interaction
Action > Reaction
Always show action reaction. Click. Show something on the map.
Zoom level bar
Kadastrale Kaart, GeogapWhat is with all the layers?!
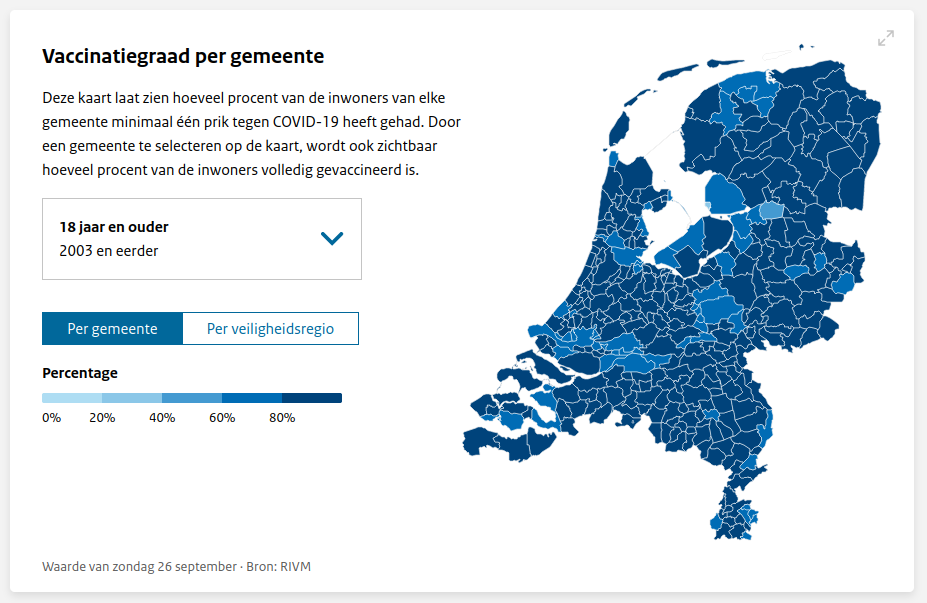
About the legend..
Minimize effort
Reduce the amount of clicks
Atlas leefomgevingInteractive legend
 Eruptions, earthquakes & emissions map
Legend as data
Integrate legend in design
The refugee projectIn summary
Thank you
| @BNiene |
| NieneB |
| NieneB.nl |
| Niene Boeijen |
niene@this-way.nl