"Let's put it on the map!"
Cartographic interaction
a two-way dialogue between a user and a map mediated by a computing device
Niene Boeijen
Some expectation management
I do not have the answer

What is this all about?
Cartography = Map making & Map use
A communication model:
a message can be passed from the mapmaker to the map user
Maps have become increasingly interactive
Robert E. Roth (2015)
Maps are manipulated by the user
Cartographic interaction
Literature...
 Robert E. Roth (2013a)
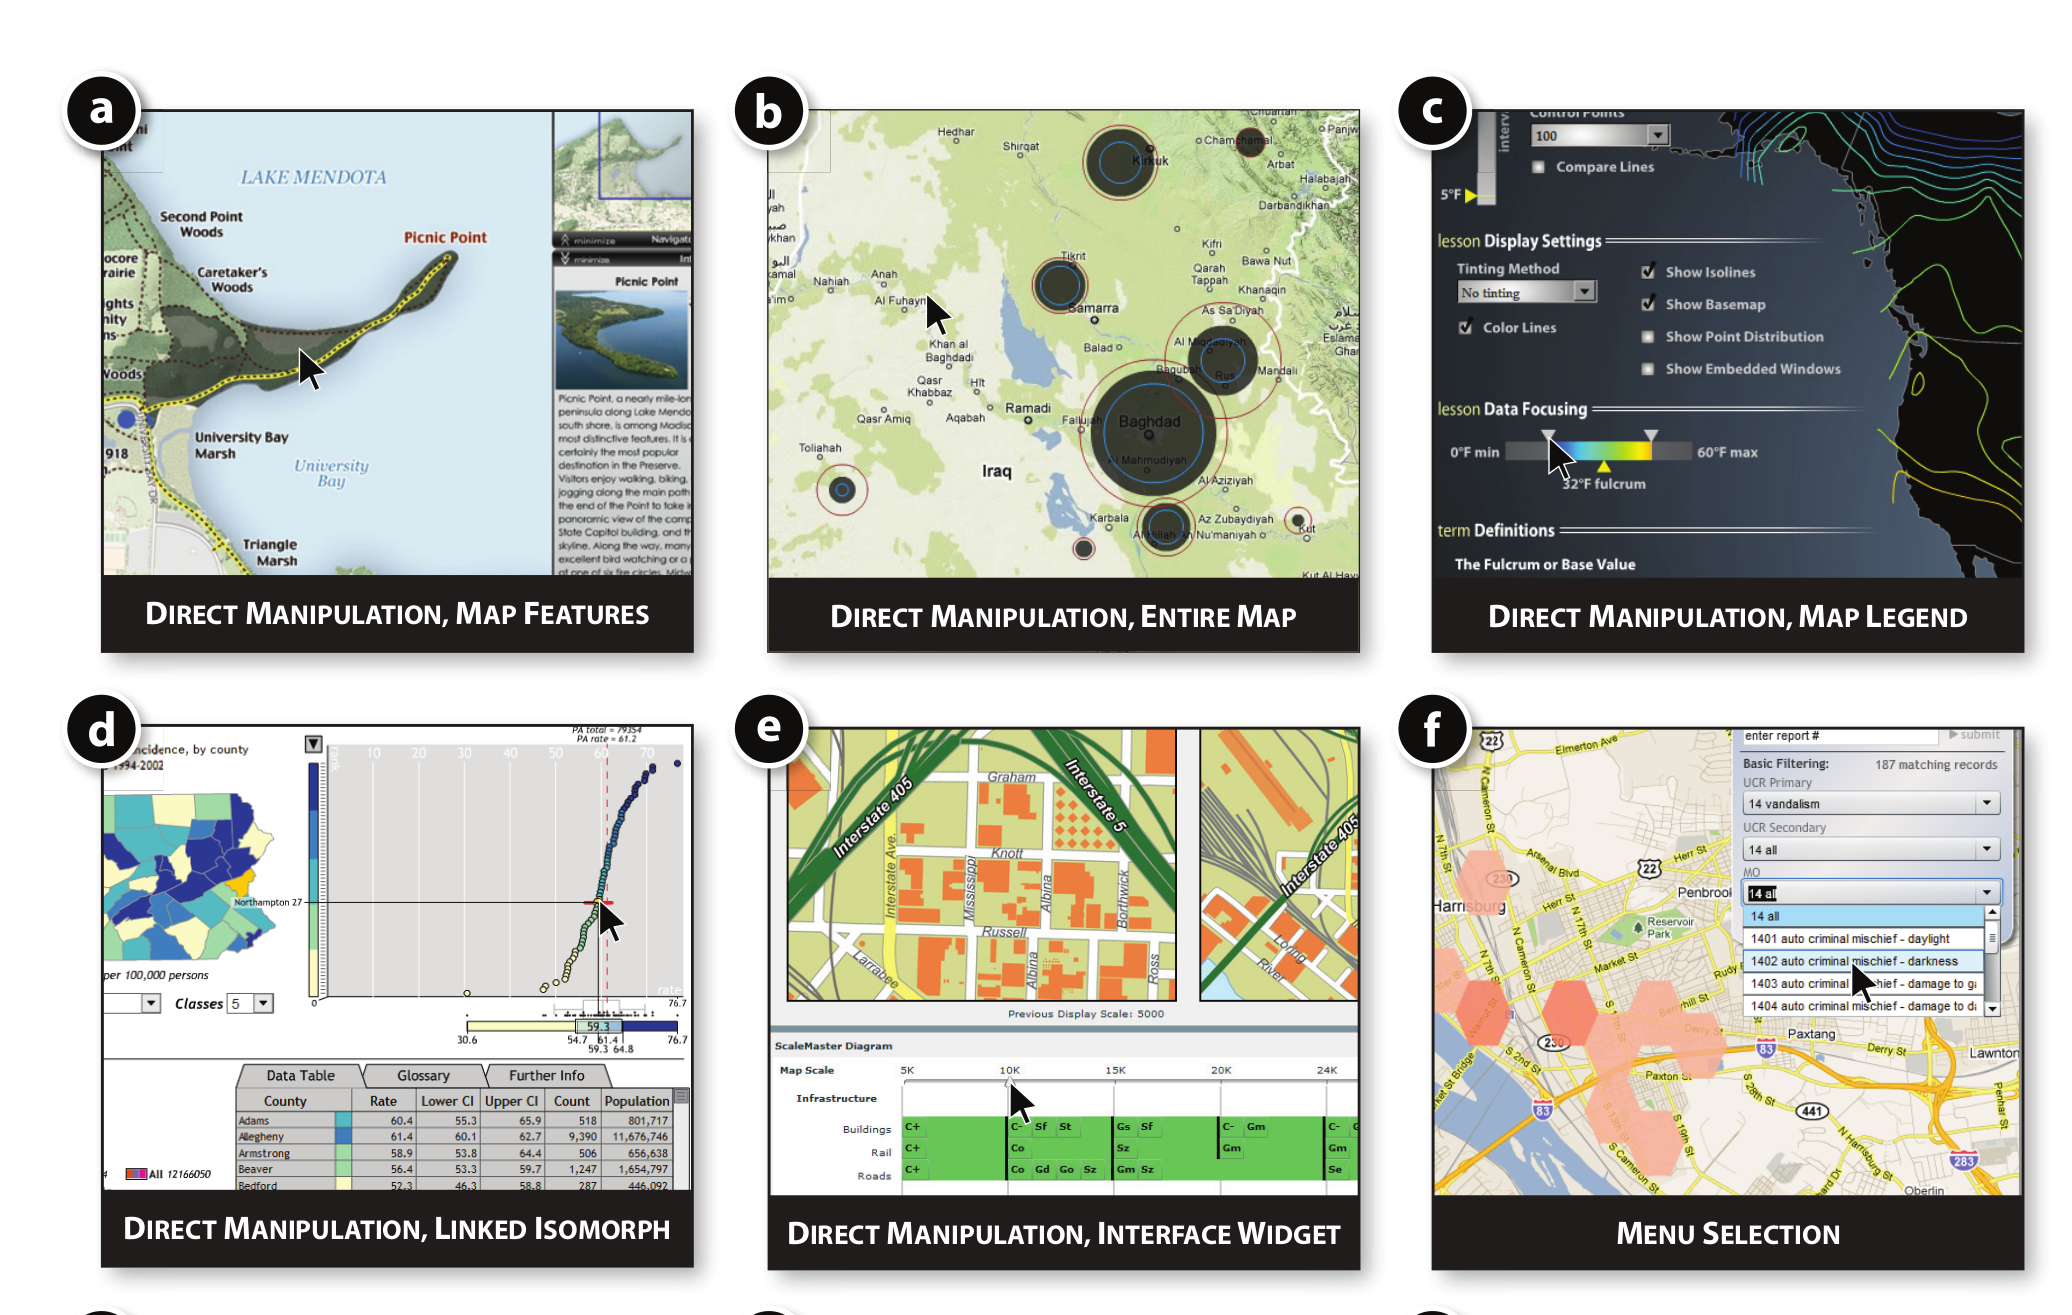
Direct manipulation
- Map Features and retrieve information
- selections, popups
- Map Legend - filter, colors
- Find more information
Entire map
- Choose base map, change context.
- Turn labels on and off
- zooming, panning
- finding a location / navigation
Menu selection - choose relevant data
Retrieve meta data, download, access data
Why do I think this is so important?
a Cartographer needs to be familiar with:
- Cartography
- Geo visualization
- Information visualization
- Interaction design
- Human-computer interaction
- IX design (interface)
- UX design (user experience)
What is UX?
User experience
Designing for the user:
Putting the user experience at the central design focus
What is a good user experience?
The user should be able to have a satisfying and valuable experience with the digital interface. To efficiently and effectively complete work and help being productive.
Bringing UX and cartography together!
Specific user experiences design for cartography is not well known..
UX meets GIS
GIS meet UX
Also design for the non-gis person!
The goal stays the same..
The user should be able to have a satisfying and valuable experience with the digital interface that contains a map. To efficiently and effectively complete work and help being productive.
Let's look at some examples
Performance
Geo data can be large, slow and hard to get into a web based map.
Slow response = a bad user experience
Action > Reaction
Always show action reaction. Click. Show something on the map.
Zoom level bar
Kadastrale Kaart, GeogapA lot of geo data slow?
- Use different technology
- Show less, or change the visualization
- Give visual feedback to the user
- Show something different
Never ever show nothing..
Less is more
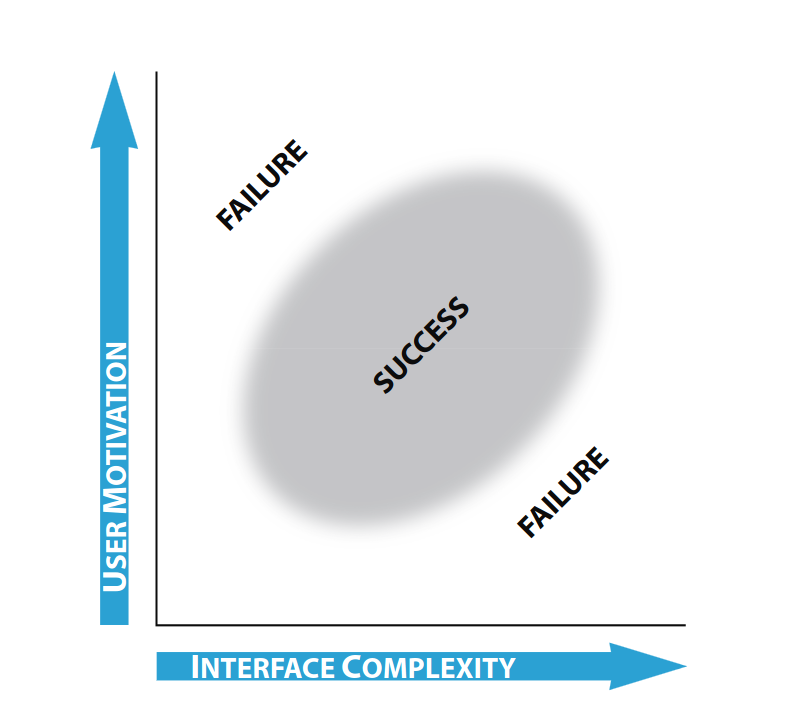
Figure from Roth and Harrower
It is the trade off between utility and usability/usefulness versus easy to use.
It is called the productivity paradox.
Simple interfaces with a small set of user tasks is sometimes more productive.
Simple interfaces with a small set of user tasks is sometimes more productive.
We love our buttons..
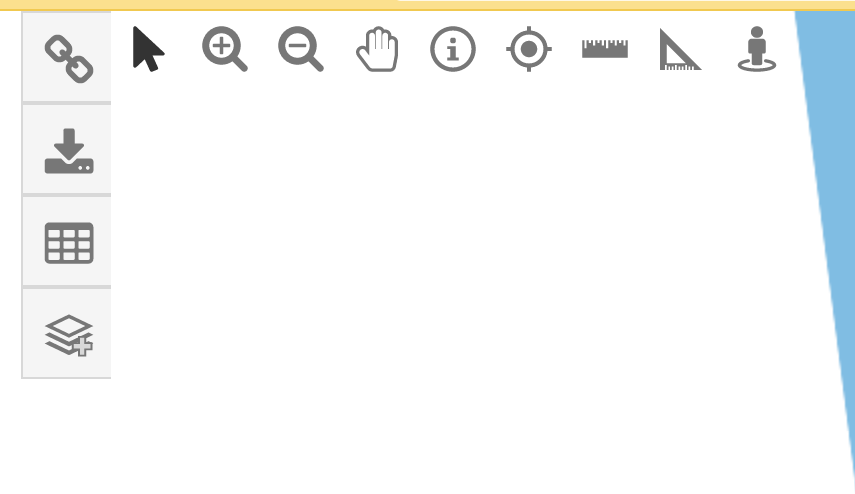
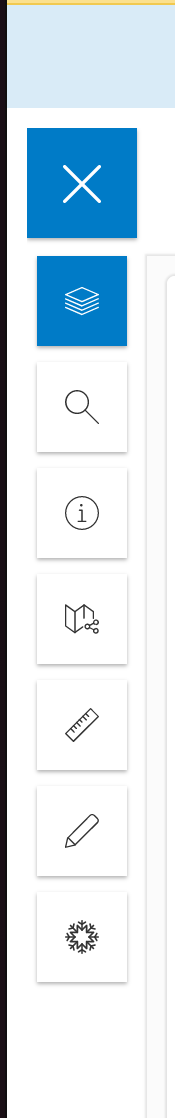
Remove redundant features
But there is a lot to show and a lot of functionality... ?
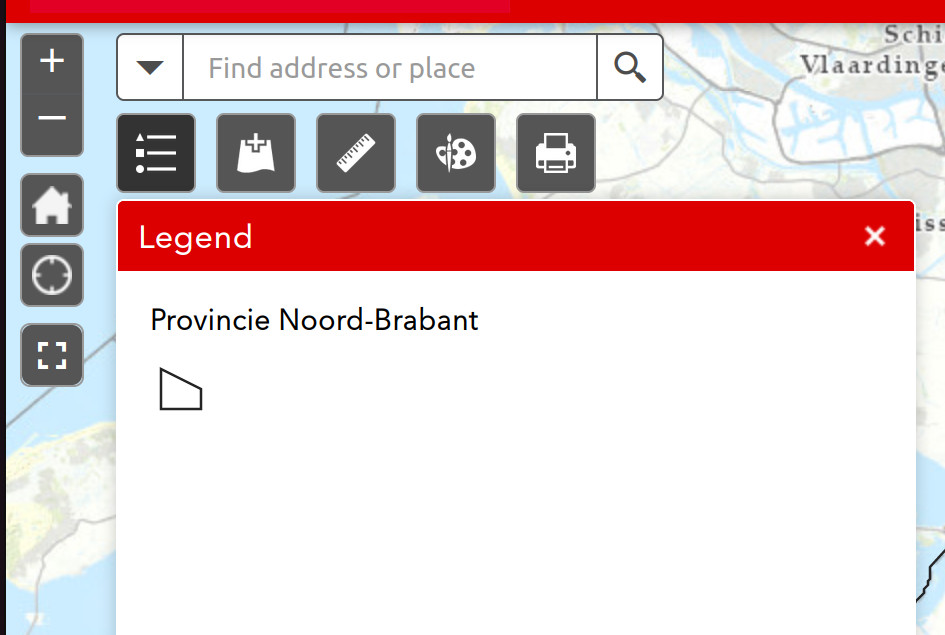
Use the interactivity!
Interactive legend
 Eruptions, earthquakes & emissions map
Group things together that go together
Gestalt law : The law of proximity is a principle in Gestalt psychology that describes how the human eye perceives elements that are close together as more related than elements that are further apart.
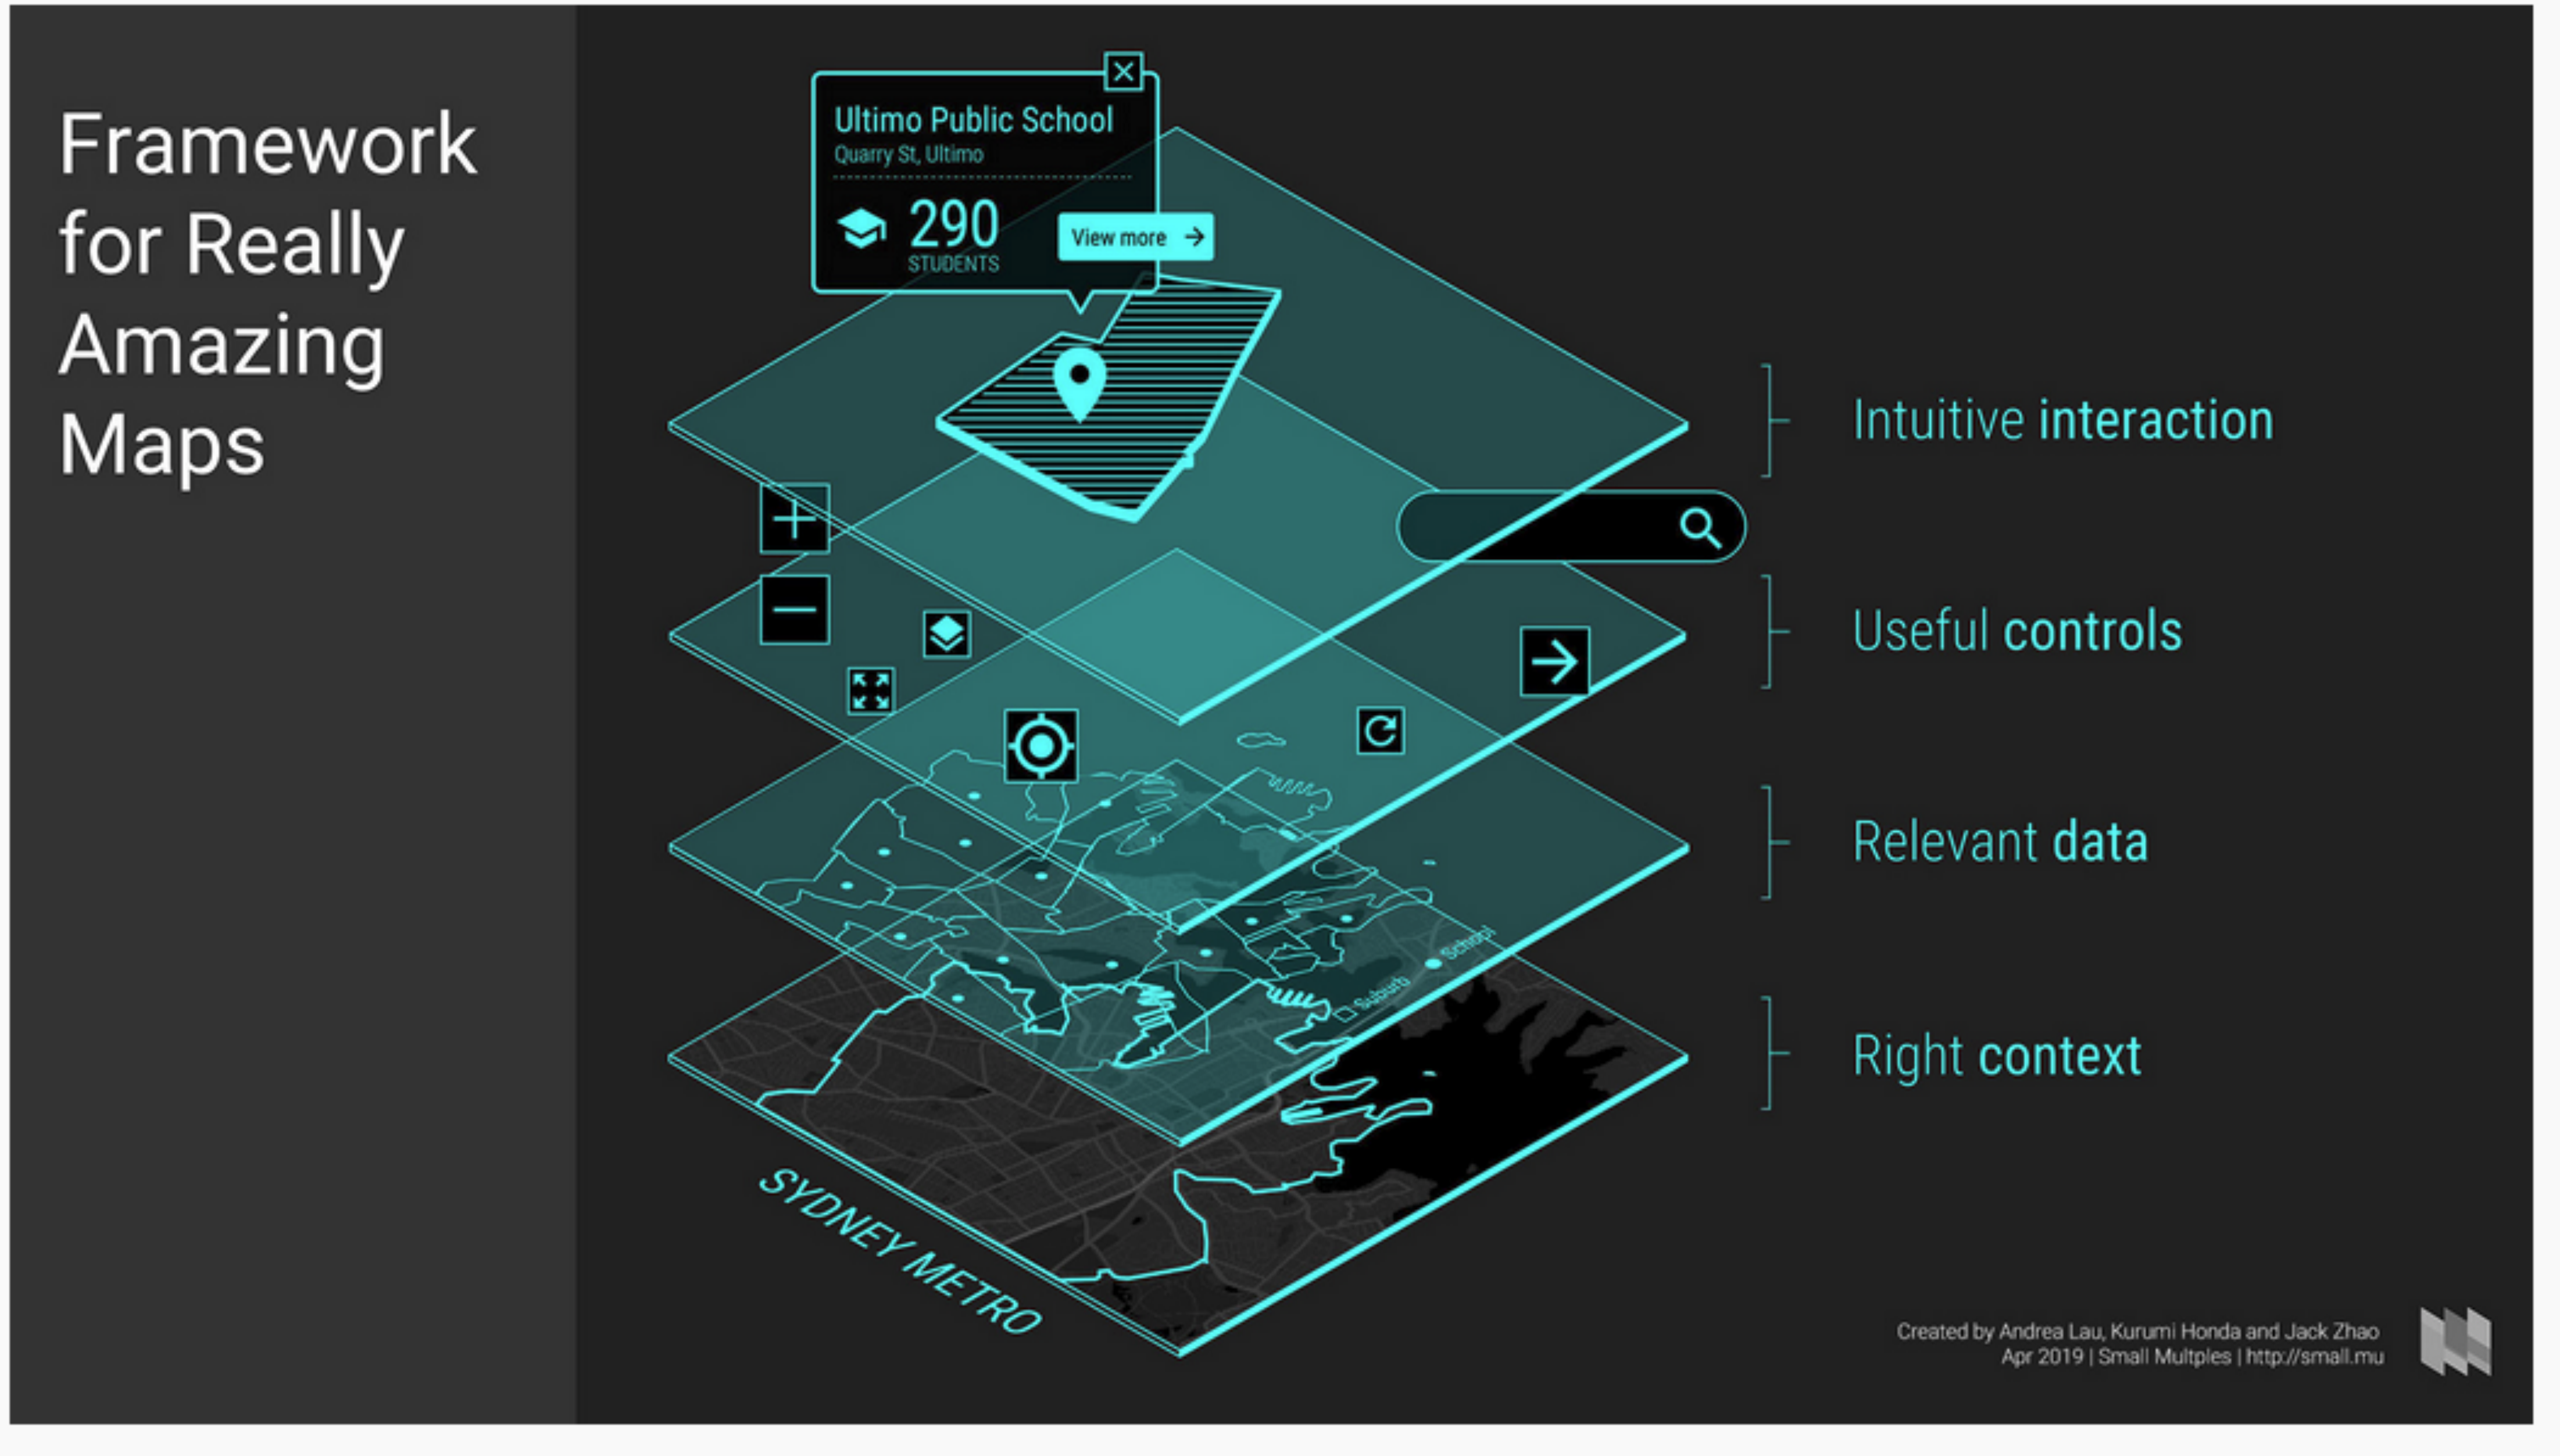
Relevant data
Map Context
In summary
a lot of geo data does not have to be slow!
Action > reaction , always give a (visual) feedback to the user
Less is more!
Make use of the interactivity
Proximity: Group things that belong together
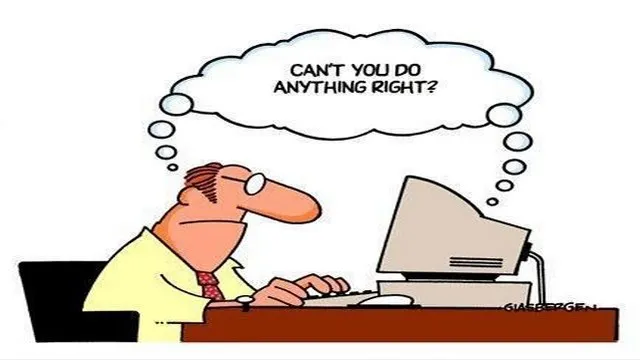
"Whenever you think you designed something idiot-proof, somebody finds a bigger idiot... "
Inspiration & Literature
Robert E. Roth (2015) Robert E. Roth (2013a) Robert E. Roth (2013b) Thanks to Robert E. Roth and all his literature!
Thanks to EOX, for consulting and learning
Thanks to the VNG for learning and working with direct user feedback
Bright Cape report
Maaike Liem for inspiration
Sjors, Coen, Frederieke, Jelmer for their input
Thank you
Please come and talk to me! Questions, remarks, discussions are all welcome!
| @BNiene |
| NieneB |
| NieneB.nl |
| Niene Boeijen |
| niene@this-way.nl |