WebCartografie & Geo Design
Gast les
Door: Niene Boeijen
Wat gaan we doen
- Over mij, ondernemen, geo design & kritische cartografie
- Power of maps, wat is een (3D) kaart? en UX/IX in cartografie
Stel vooral vragen!
Even voorstellen
Niene Boeijen
Waarom vinden wij kaarten toch zo leuk?
De macht van kaarten
Kaarten bestaan al heel lang..
The Babylonian Map of the World, First known map of the world. 6th century BC,

To impose some kind of order and structure onto the vast, apparently limitless space of the
known world.
A god like perspective on earthly creation
Showing magical power and authority. This is the world and it is ours.
De drang om de wereld in kaart te brengen is menselijk, een instinct
We make sense of ourselves in relation to the physical world by processing information spatially
Our brains organize by location .. why so many relate to maps and geography is that we have no choice but to think and see spatially.
"Everything is related to everything else, but near things are more related than distant things"Tobler's first law of geography
Macht van kaarten
6 punten door Carton
- External representations, making explicit and fixing our spatial surroundings. Artefact to share
- See more at once, scale
- Visual nature, eye-brain system
- Pieces of art, visual beauty
- Authoritative status of their own .. historically
- Political, government, planning, land registration
Cognitive Mapping
Hoe zien wij de wereld? Hoe zien wij onszelf in de wereld?
De kaart, of visualisatie is de behoefte van de mens om zich ruimtelijk uit te drukken
een mental map is dus een afbeelding van persoonlijke perceptie van een geografische gebied en cognitie. Het is een mix van objectieve kennis en subjectieve perceptie.
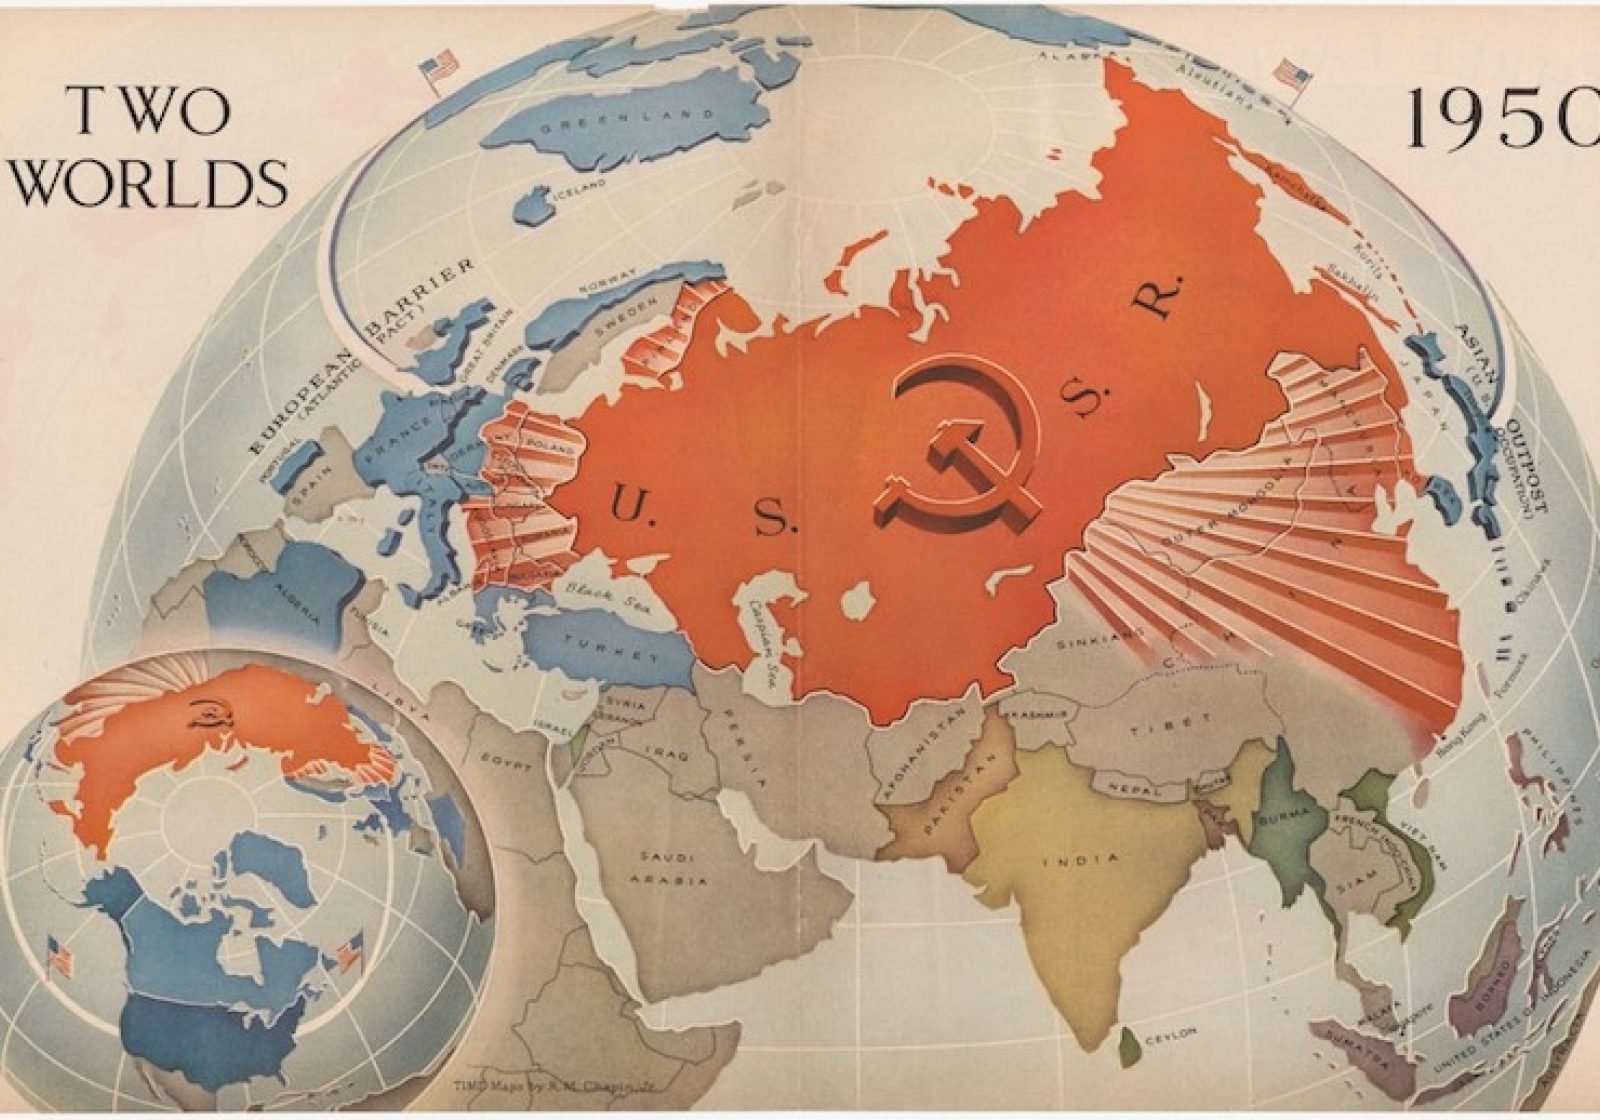
Een kaart is niet neutraal
Kaart = Macht
Cartography does not constitute a neutral discipline that can be
equally used to implement
either state violence or resistive endeavors. Cartography is inherently an instrument of
power

Wat is een kaart?
Simultaneously both a physical object and a graphic document, and it is both written and visual; you cannot understand a mpa without writing, but a map without a visual element is simply a collection of place names.
It offers a spatial understanding of events in the human world; but, it is often also about time. as it asks the viewer to observe how these events unfold one after another
Discussie
Definities opzoeken
- geovisualisatie
- cartografie
- kaart
- schematische kaart
- Thematische kaart
- topografische kaart
10 min
Definition of a map (International Cartographic Association 2003):
“A symbolized representation of a geographical reality, representing selected features and characteristics, resulting from the creative effort of its author’s execution of choices, that is designed for use when spatial relationships are of primary relevance.”
- een grafische/symbolische weergave van ruimtelijke aspecten van de werkelijkheid
- een gemodelleerde weergave van het (aard)oppervlak; meestal een geografische weergave, soms schematisch
- model: betekent gereduceerd/versimpeld. keuzes over weg laten en aggregeren
- een visuele representatie
Wat is cartografie?
Definition of Cartography (International Cartographic Association 2003): Cartography is the discipline dealing with the art, science and technology of making and using maps.Visualisatie
Communicatie >> doelgroep!
Papieren of digitale kaart!
Cartographic interaction
Wat is belangrijk om te weten als je een interactie web map maakt?
Heel veel..
Veel theorie komt uit de tijd van drukwerk en statische digitale kaarten
van drukwerk (till 1980)
naar digitaal (computer )
naar het web! (2005 to the web)
topografische/ Referentie kaarten
Wereld beeld afbeelden
Ontdekkingen in kaart brengen
Militaire veroveringen
Scheepsvaart
Thematische kaarten (19de eeuw)
Bijhouden van data
Beroemd voorbeeld: Snow
Digitale kaarten
Computer uitvinding
GIS
Information age
vaak statisch
Interactive kaarten
popups
verschijnen/verdwijnen
animatie
Zoom baar
Door de gebruiker manipuleerbaar
verdiepende lagen
What is going on?
Kaart Elementen
Title
Legenda
Noordpijl
Schaal
Metadata
Referentie kaart
Interactieve kaart elementen
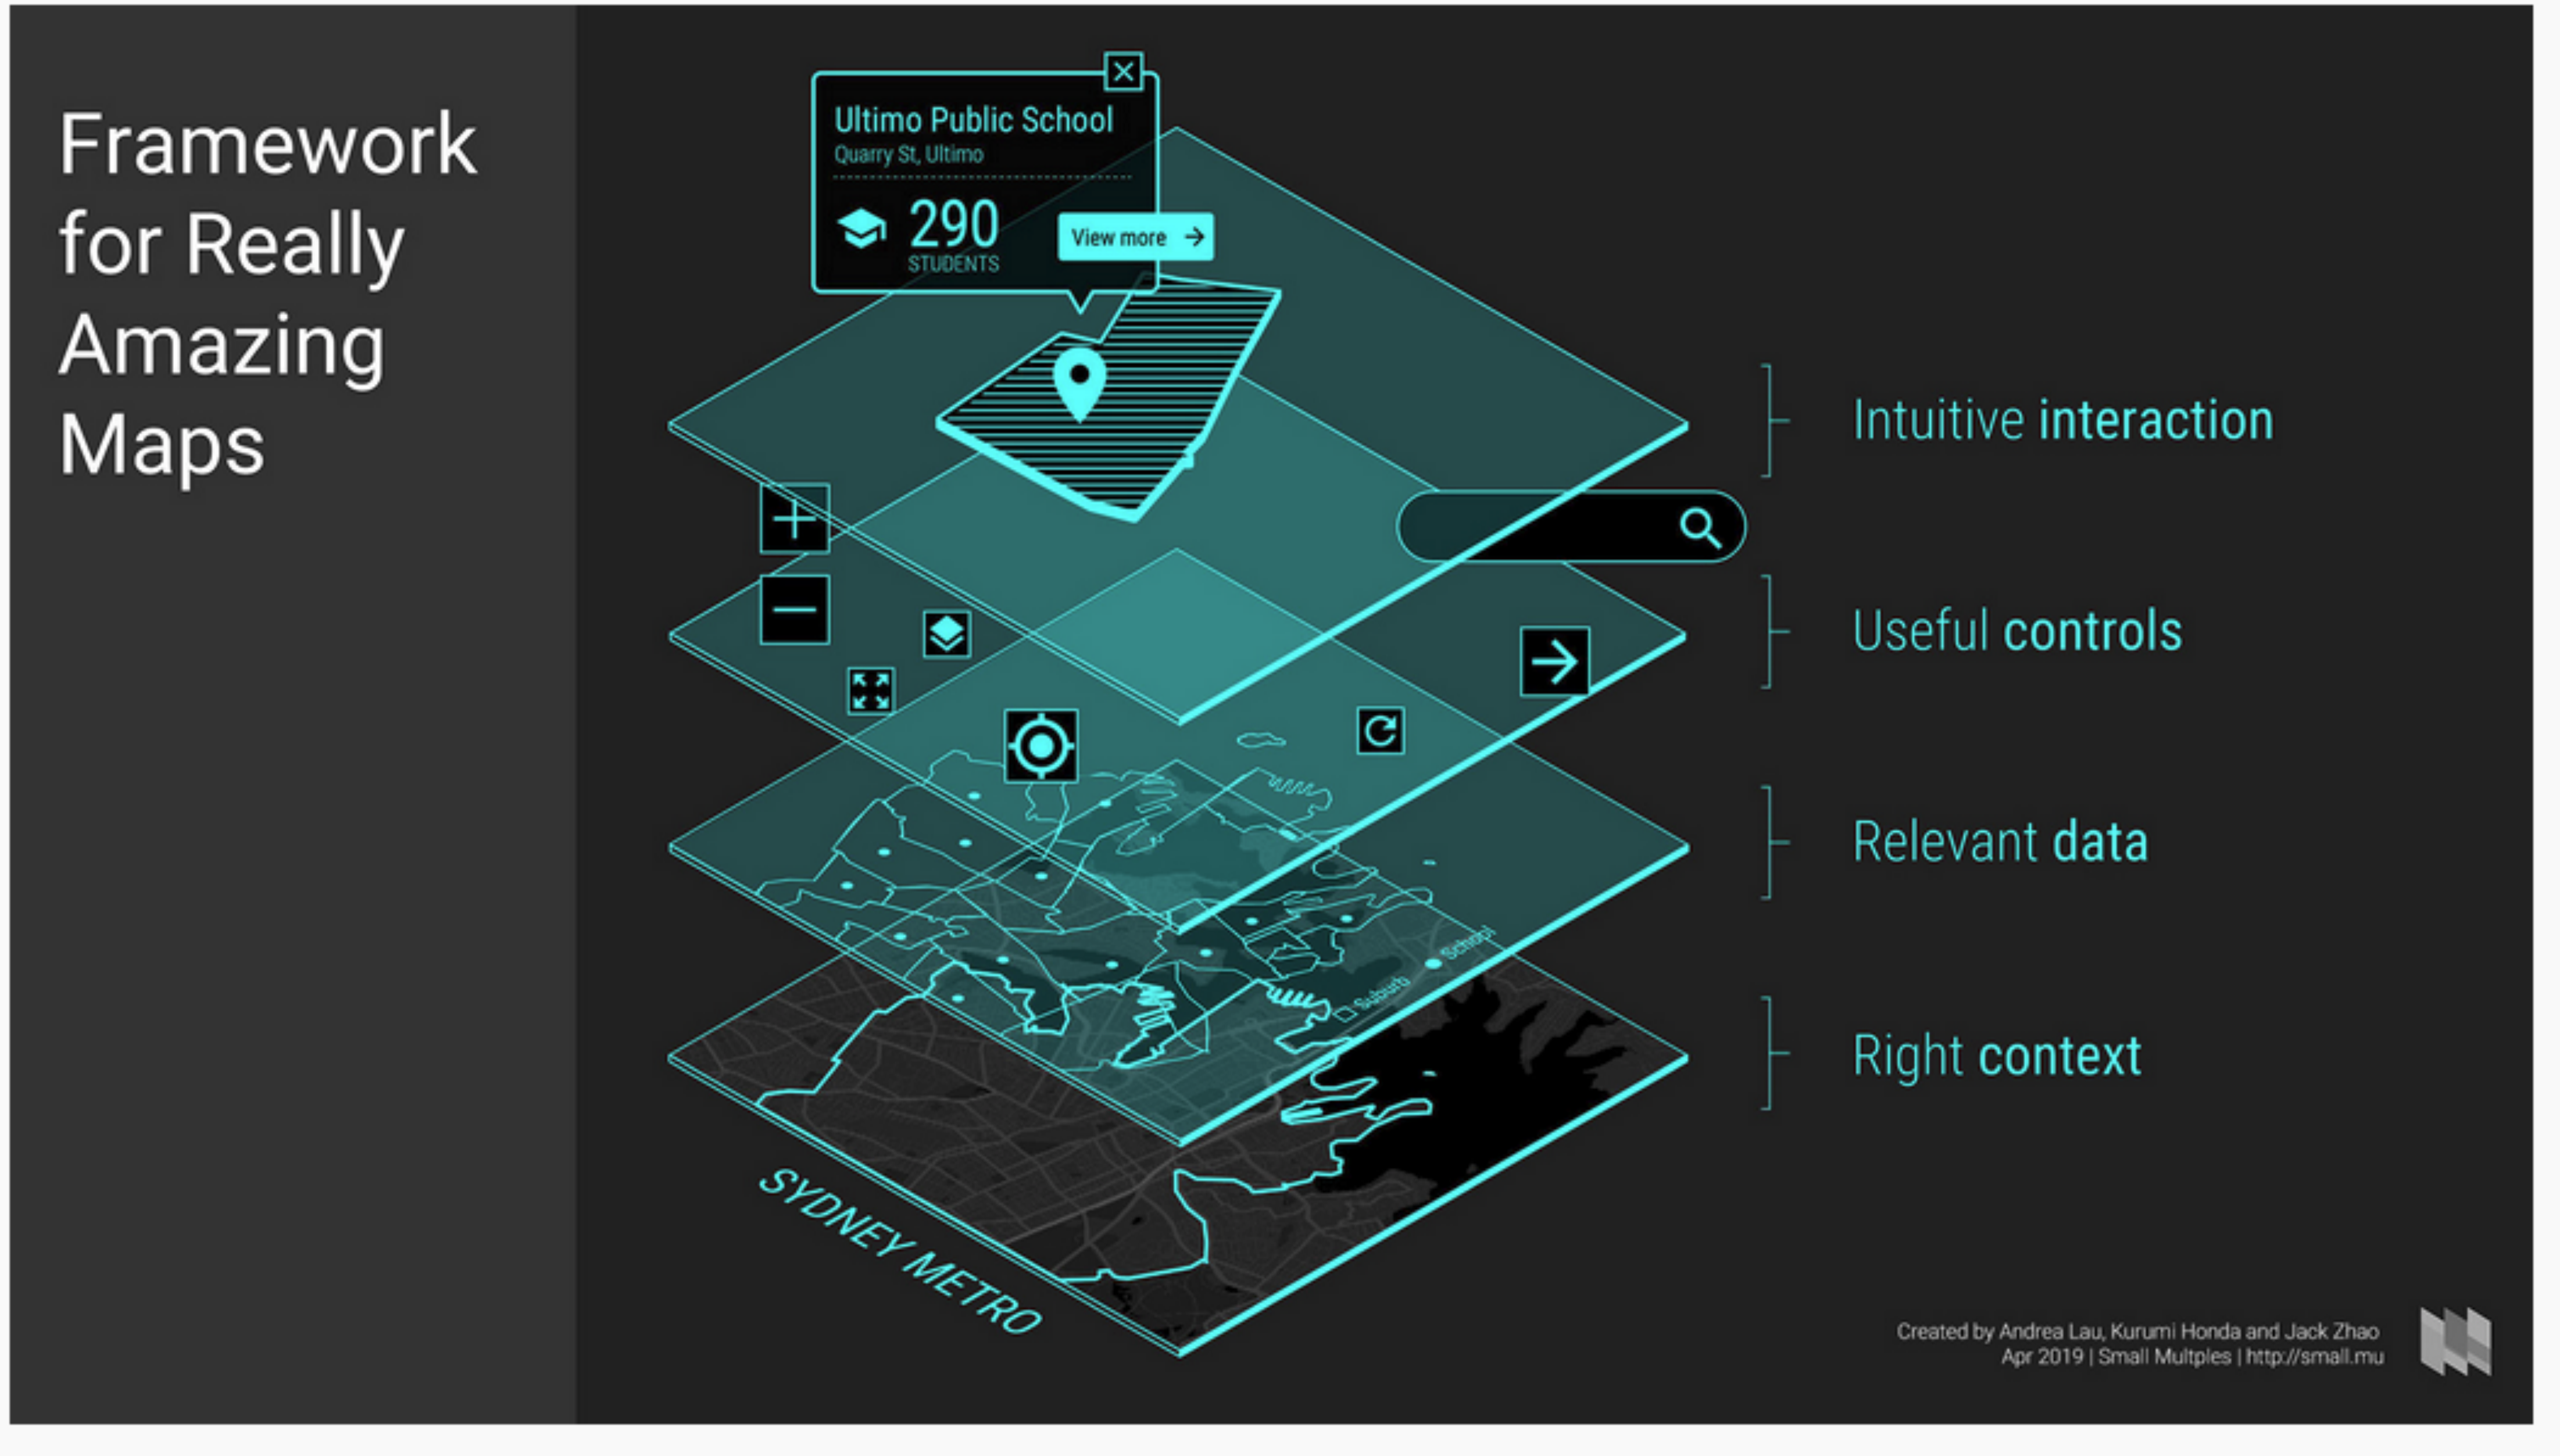
Map interaction
of interactive cartography
Changed by the user . manipulation
- digital (on a computer, tablet, smartphone)
- Responsive to direct user manipulation
- changeable in some way
Roth
Types of interaction
- Map navigation: changing where the map is focused
- Search and filter: finding specific objects or sets of objects
- Information retrieval: getting more information than what the map shows
- Data manipulation: changing what the map and supporting elements are showing
Interactieve kaart elementen
Naming elements of a map
- Context data
- Relevant data
- Navigation
- Configuration context
- Legend
- Meta data and source references
- Titles and info about relevant data
- Search and Find
- Relevant data choice, filters for data manipulation
Voorbeeld
Elementen benoemen
dego.vng.nlLegenda
interactief
aan/uit
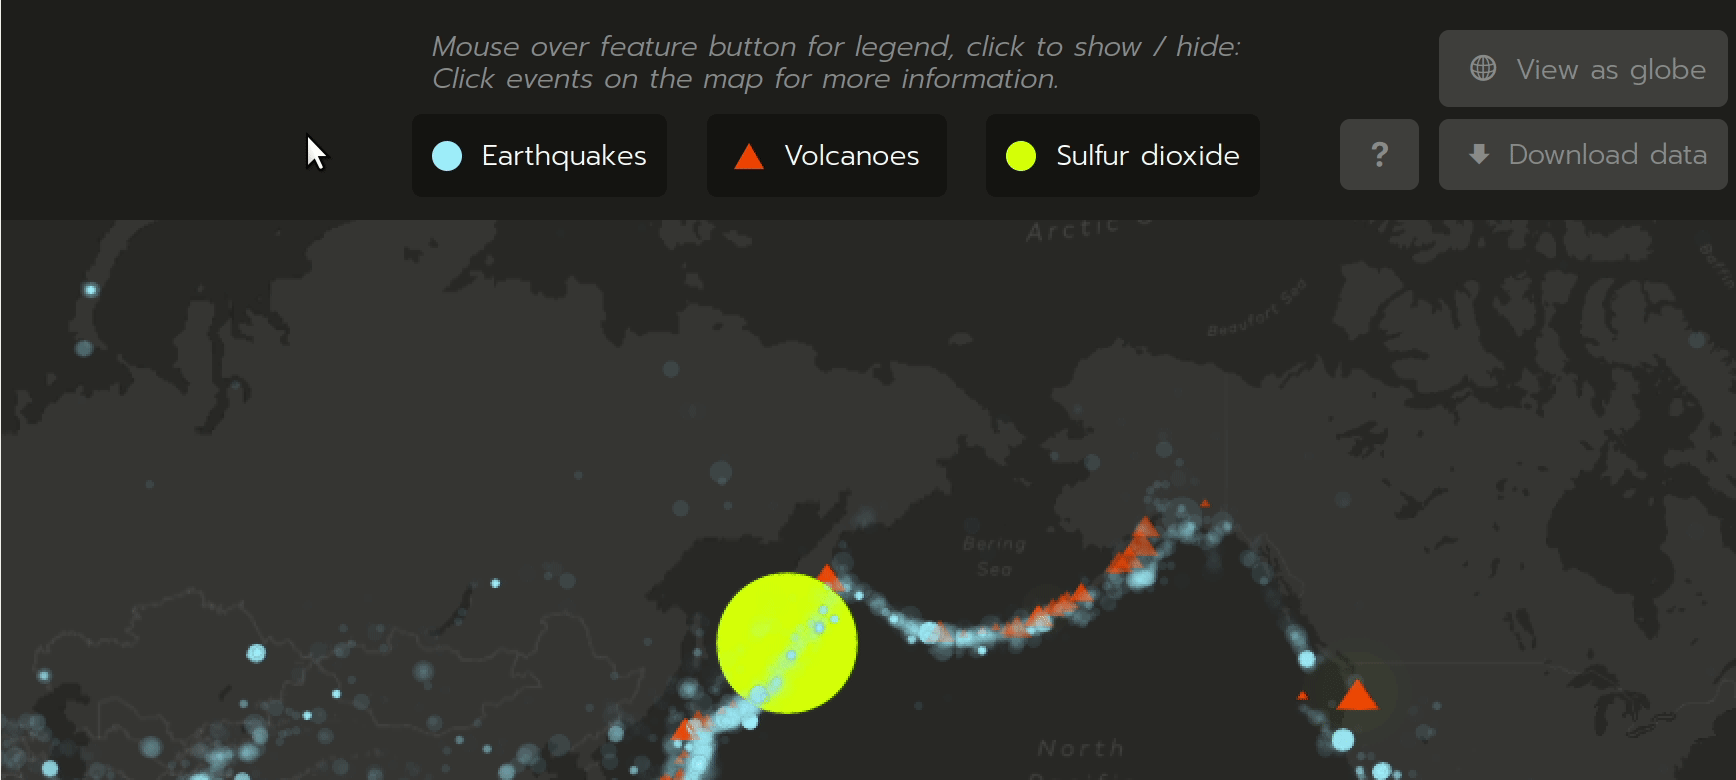 Interactieve legenda
Integreer legenda in design en (relevante) data keuze
refugee projectNoordpijl en schaal
verdwijnt? is het noodzakelijk?
wordt zooming, panning
Scroll
Tapping
pinch to zoom
+ en - knoppen
noordpijl is draai knop
Tegenwoordig logisch! Hou het simpel.
Overzichtskaart?
zien we bijna niet meer
Neemt veel plek in
Leuke nieuwe feature die je vaak ziet:
Knop terug naar overzicht!
The realization of the interactive map as an experience, not just a map design.[source]
Wat kan helpen?
Visual Hierarchy and Layout
De kaart als onderdeel van het geheel
Plaats elementen in een logische volgorde van belangrijkheid,
Gaat om het communiceren van een verhaal!
toxmapLayout
Visuele hierarchy
Belangrijkste eerst

Gestalt
Proximity
Figure-ground
Similarity
Symmetry
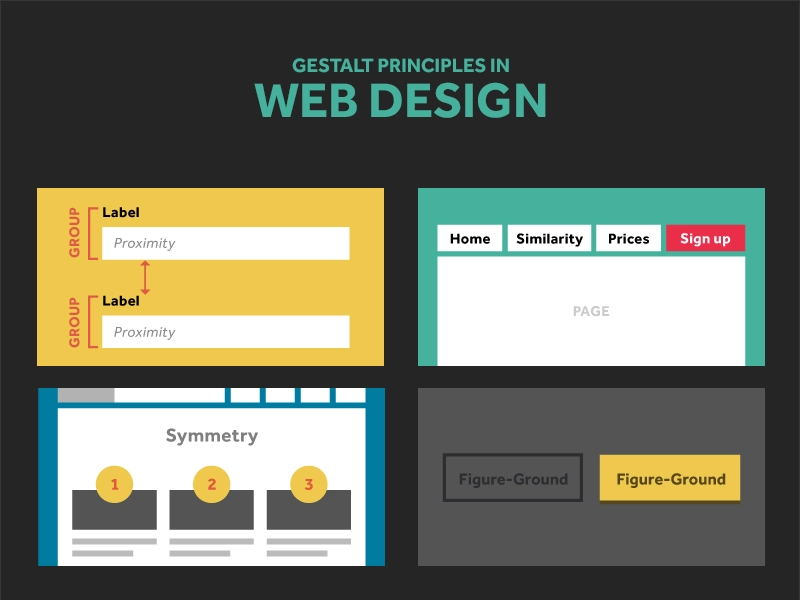
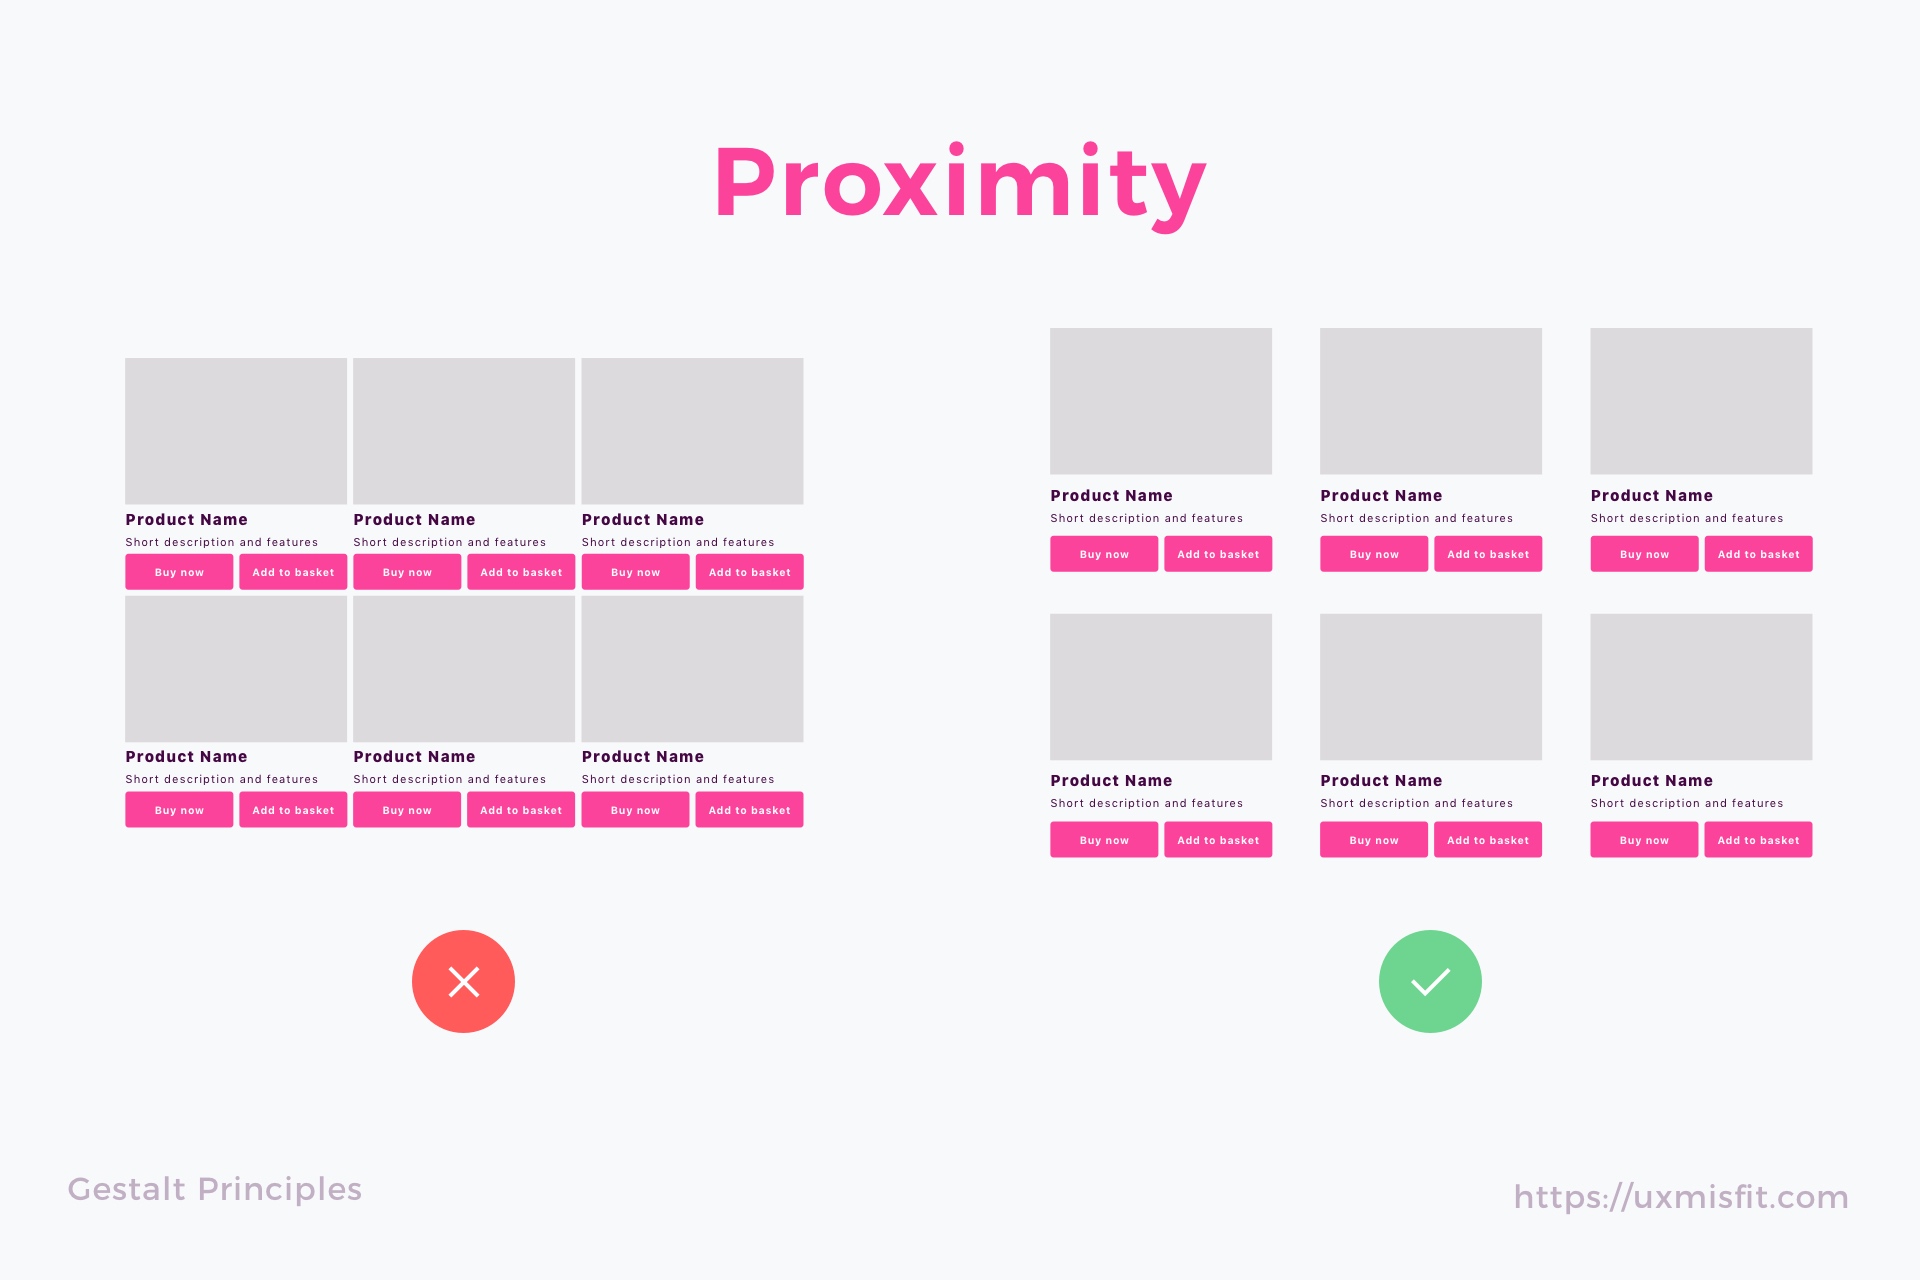
Objects that are close together are perceived as a group.
bron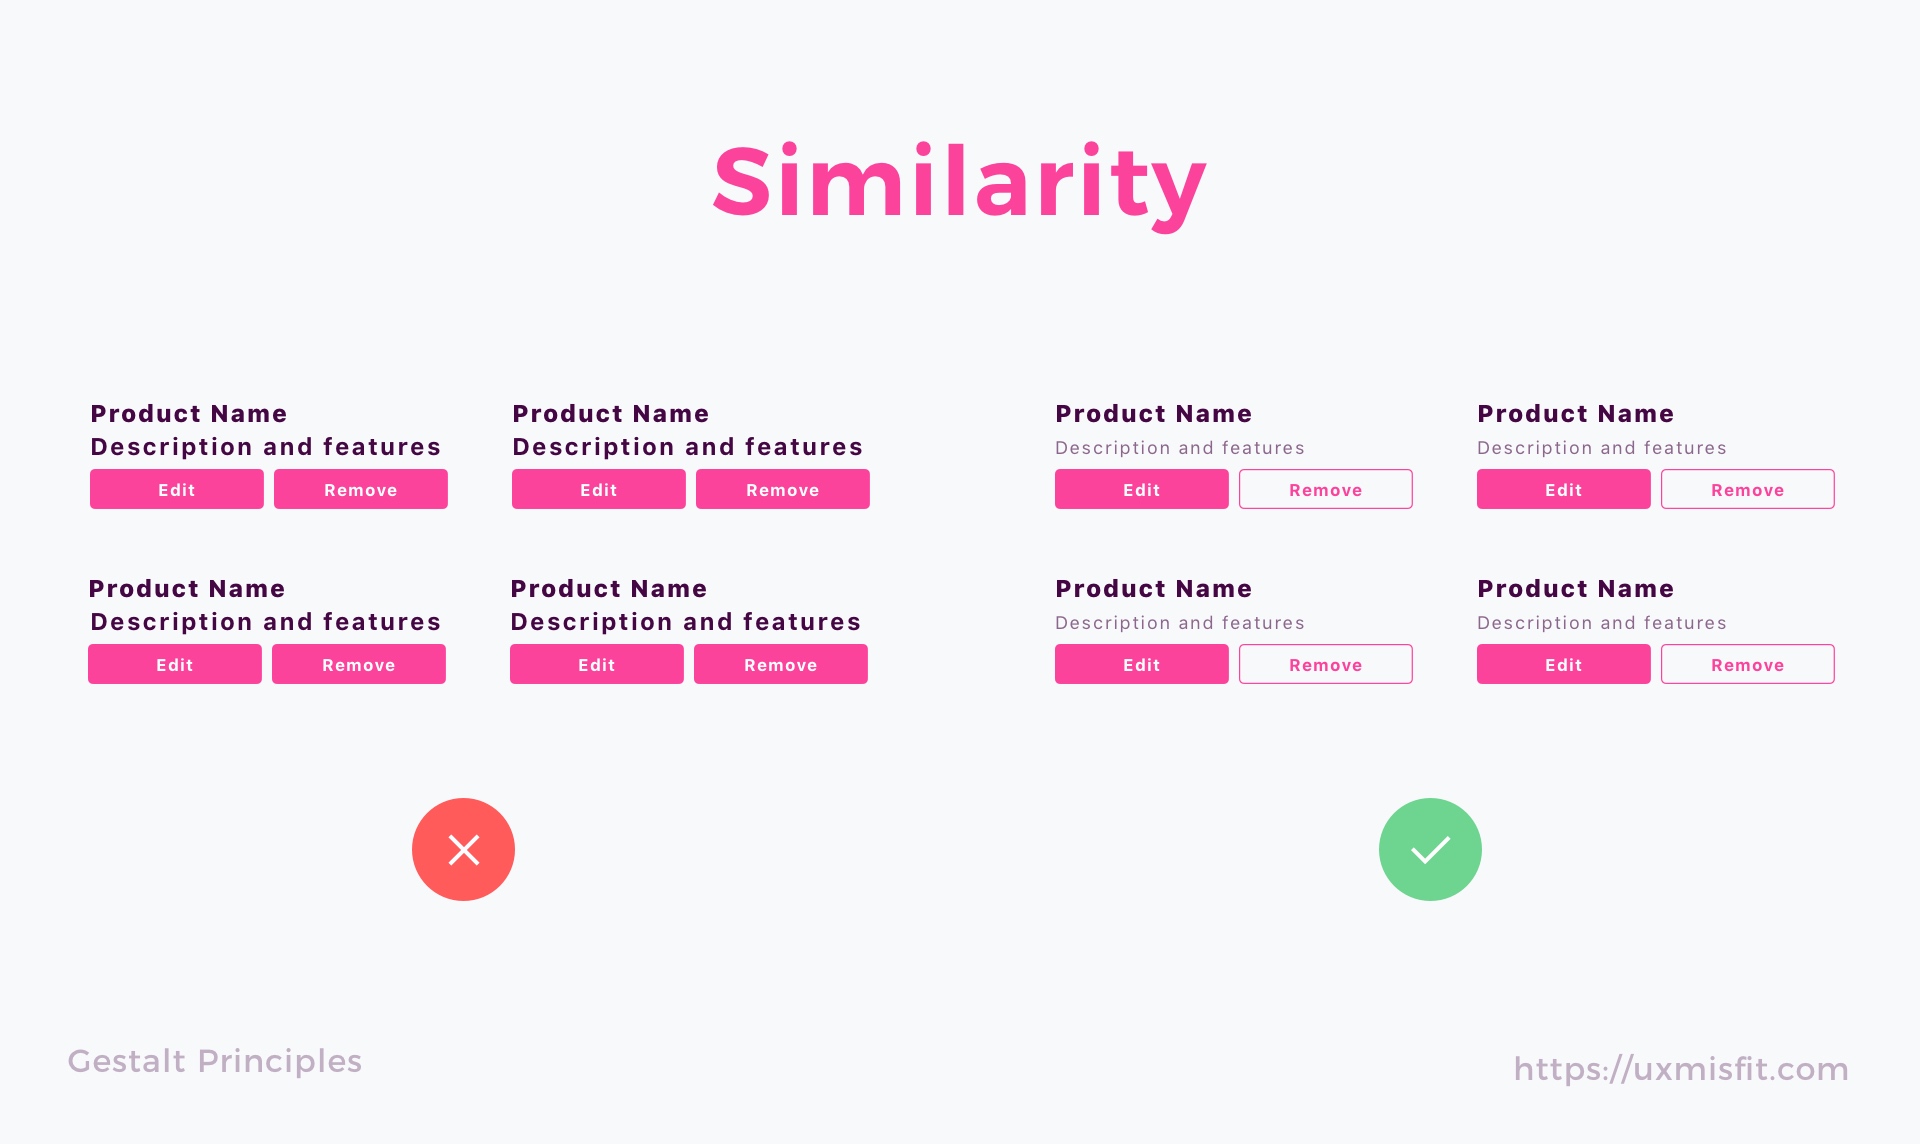
Shared visual characteristics create relationships
bronDenk aan plaatsing van elementen in relatie tot context, relevant, actief, passief
dego.vng.nl
General UX tips:
Onderzoeks opdracht
Web map exploration
Vind alle elementen en zoek verbeter kansen!
Kies een web map dashboard uit.
Benoem alle onderdelen - map elementen
Vind verbeter punten - Layout, gestalt
Denk hierbij aan:
- Wat is het doel? Wie is de doelgroep?
- Benoem alle elementen. Context, relevant, navigatie, actief/passief
- Visuele hierarchy, layout, staan de elementen op de juiste plaats? Zijn ze juist gevisualiseerd?
Werk in 2-tallen
Presenteer kort even jouw dashboard en bevindingen
3 slides - 5 minuten
Kies/verdeel :
- race.esa.int/
- kansenkaart.nl
- www.klimaateffectatlas.nl
- www.opportunityatlas.org
- kankeratlas.iknl.nl
- www.atlasleefomgeving.nl/kaarten
- www.warmteatlas.nl/viewer/app/Warmteatlas/v2
15 min aan de slag!